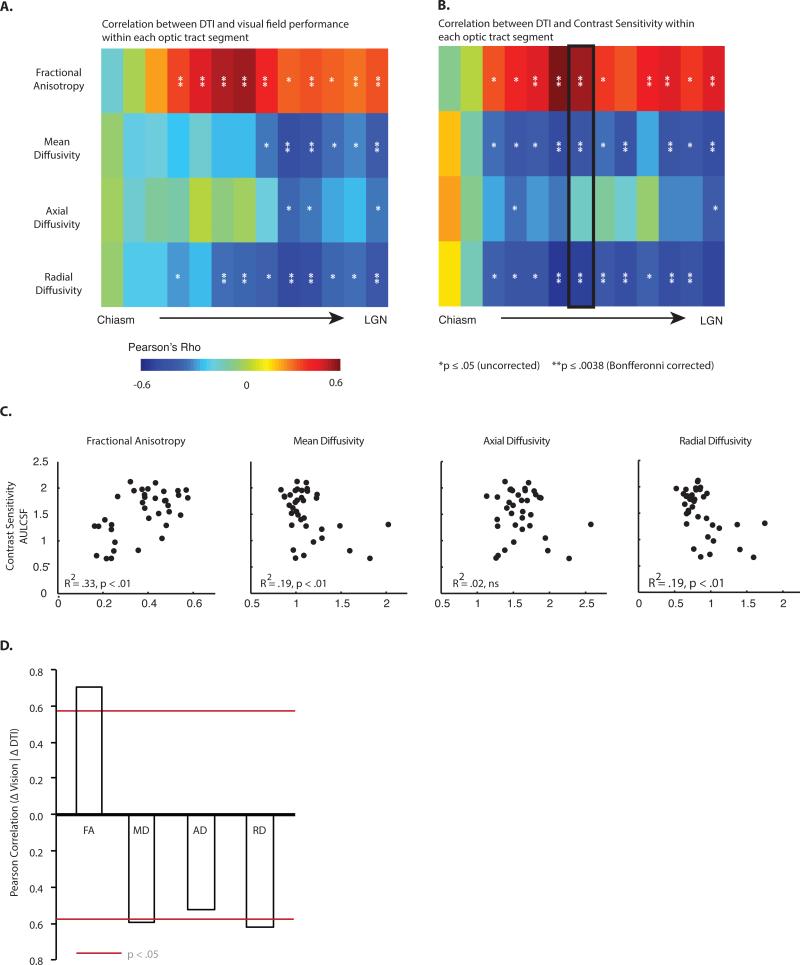
Figure 4. Relation between diffusion indices and visual ability.
Within each segment of the optic tract, variability across all patients in diffusion indices was correlated with variability in (A) visual fields, and (B) AULCSF (area under the log contrast sensitivity function). Diffusion indices from a given optic tract (e.g., right) were correlated with psychophysical data from the contralateral visual field (e.g., left). While no relationships were observed between axial diffusivity and visual ability, radial diffusivity was negatively correlated with visual abilities. Near the optic chiasm (i.e. the first two segments), correlations were consistently poor for all diffusion indices, likely due to artifacts from crossing retinofugal axons at the chiasm (* p < .05, uncorrected, ** p < .0083, Bonferroni corrected). (C) Diffusivity values from the middle segment of the optic tract (segment 7) are plotted against AULCSF. (D) A summary of the correlation between the change in diffusivity measurements in the optic tract and the change in visual abilities, as a function of surgery.

