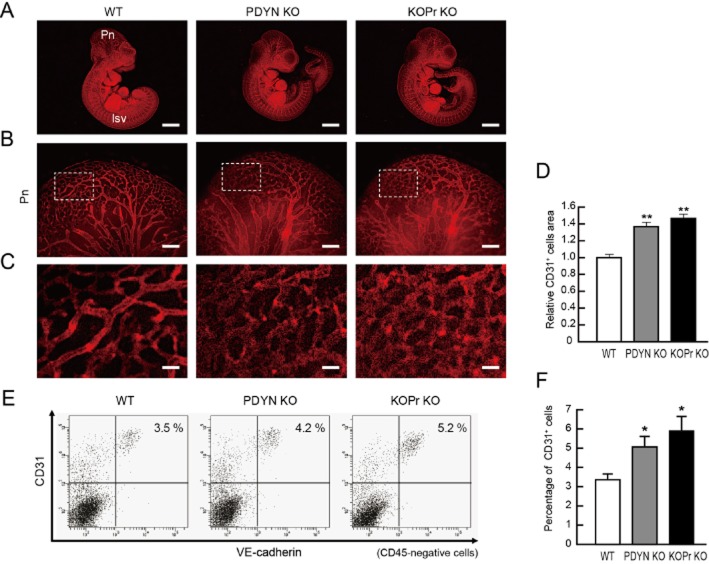
Figure 2.
Representative results of WT, prodynorphin-null (PDYN KO) and κ opioid receptor-null (KOPr KO) mouse embryos at E10.5 (A). Whole-mount CD31 (red) staining. Left panels, WT mice. Pn; perineural vascular plexus, Isv; intersomitic vessels. Middle panels, PDYN KO mice. Right panels, KOPr KO mice. Scale bars: 2 mm. (B) High-magnification views of CD31-stained Pn region. Scale bars: 200 μm. (C) Higher magnification views corresponding to boxed regions in Figure 2B. Scale bars: 40 μm. (D) Quantitative evaluation of CD31+ area in Pn. CD31 staining of WT mice was set as 1.0. (n = 3, **P < 0.01 vs. WT). (E) Flow cytometry. X-axis: VE-cadherin, Y-axis: CD31. Percentages of CD31+/VE-cadherin+/CD45-ECs in the embryo are indicated. (F) Quantitative evaluation of CD31+/VE-cadherin+/CD45-ECs in the embryo. n = 3; *P < 0.05 vs. WT (adapted from Yamamizu et al., 2011).

