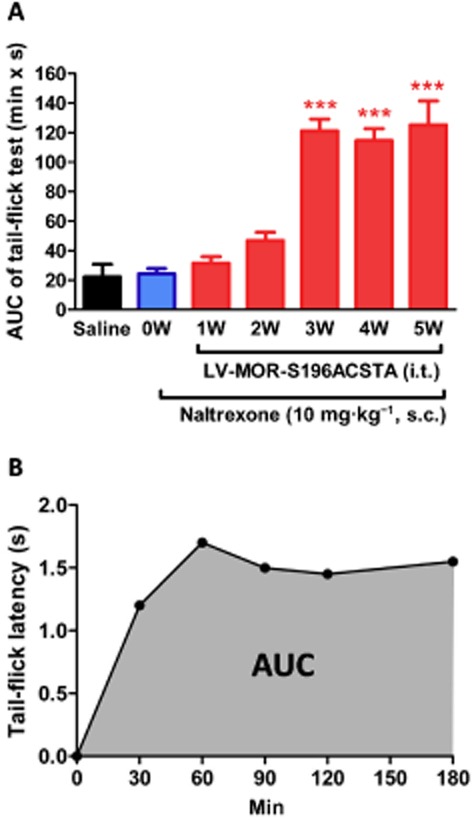
Figure 3.

The development of the antinociceptive effects of naltrexone (A) The time course of the developed antinociceptive effects of naltrexone before and after gene transfection (1–5 weeks). (B) A representative time-effect curve of naltrexone (10 mg·kg−1, s.c.) determined by the tail-flick test after transfection of the MOR-S196ACSTA-eGFP gene into the spinal cord of C57BL/6J mice for 3 weeks (3 W). Data are presented as means ± SEM. One-way anova and Newman–Keuls test were used to analyse the data. ***P < 0.001, significantly different from pretest data of naltrexone, before gene transfection (0 W).
