
Figure 3.
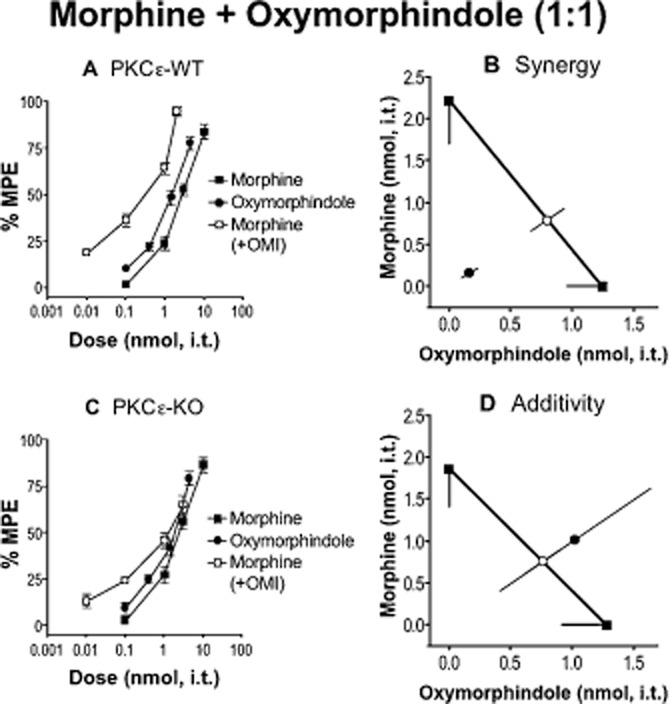
Morphine and oxymorphindole (OMI) require PKCε for spinal analgesic synergy. (A, C) Dose–response curves for morphine, OMI and a 1:1 combination of the two in PKCε-WT (A) and -KO (C) mice. Error bars for each data point represent SEM. (B, D) Isobolograms showing OMI dose and ED50 (square) on the x-axis, morphine dose and ED50 (square) on the y-axis, theoretical additive ED50 for a 1:1 combination (open circle on line of theoretical additivity), and observed combined ED50 (filled circle). Error bars represent 95% confidence limits. (B) Morphine and OMI produce analgesic synergy at the spinal level in PKCε-WT mice. (D) The combination of morphine and OMI is additive in PKCε-KO mice. For morphine, n = 12 in PKCε-WT and n = 11 in PKCε-KO. For OMI and morphine + OMI, n = 6 for PKCε-WT and PKCε-KO. Numerical details including ED50 value for each dose–response curve, and P-value for each interaction can be found in Table 1.