Figure 3.

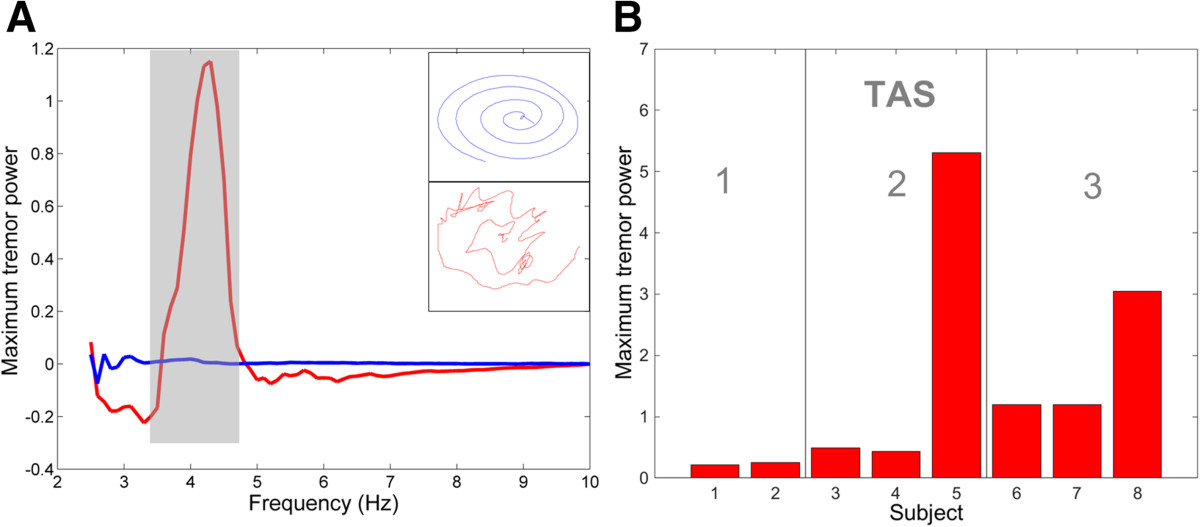
Tremor assessment using the spiral drawing task. (A) Power spectra (with low-frequency drift removed) and sample spiral drawings (inset) for Subject 6 with MS (red; TAS = 3) and an age-matched control subject (blue). The shaded area highlights the range of frequencies associated with the subject’s tremor. (B) Maximum power within the 2–5 Hz frequency range for subjects with MS together with their corresponding tremor assessment score (TAS).
