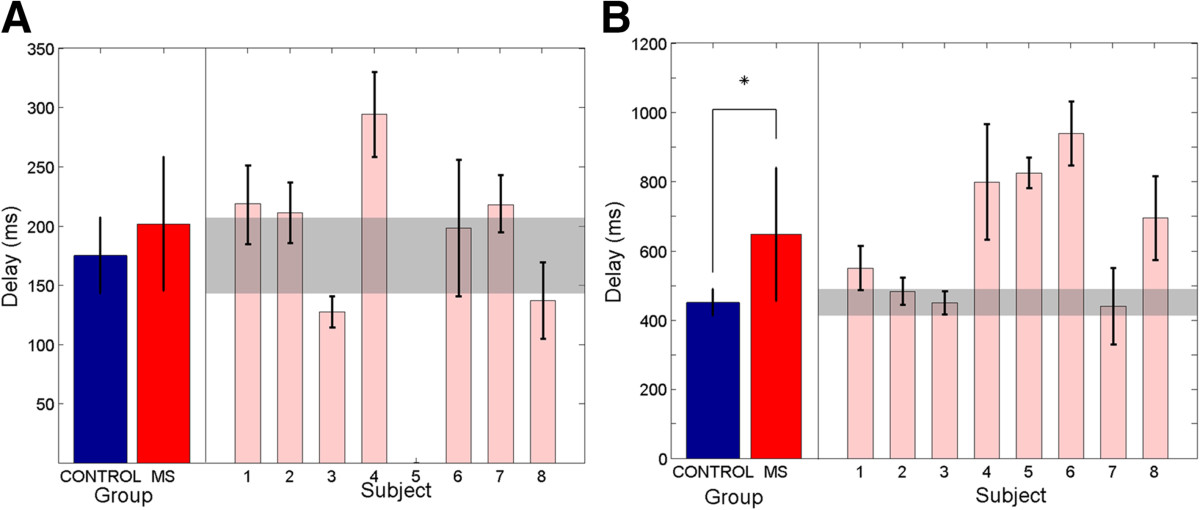
Figure 4.

Visual and proprioceptive response delays for control subjects (blue) and subjects with MS (red). (A) Group visual response delays are shown on the left. Visual response delays for individual subjects with MS are shown on the right together. (B) Group proprioceptive response delays are shown on the left. Proprioceptive response delays for subjects with MS are shown individually on the right. Error bars denote ± SD for group and individual measures respectively. Shaded regions denote the corresponding ranges (±SD) for the control group.
