
Figure 5.
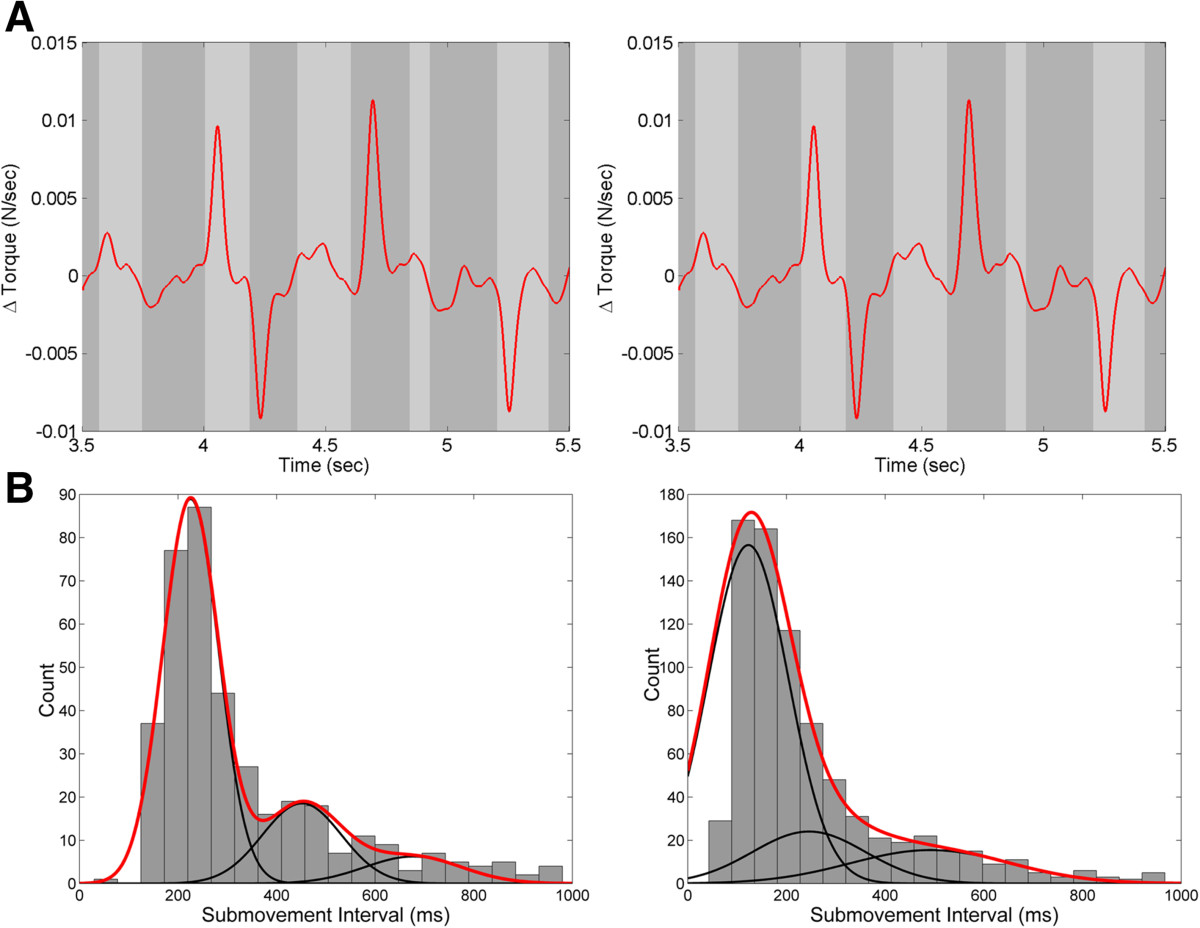
Characterization of visual and proprioceptive submovement intervals. (A) Movement velocity profiles used to calculate visual (left) and proprioceptive (right) submovment intervals for Subject 4 (MS, TAS = 2). Examples of individual submovements are highlighted (gray) (B) Distribution of submovement intervals across trials for vision (left) and proprioception (right) for a representative subject with MS (Subject 4). The submovement interval for each subject was characterized by the mean and standard deviation of the best-fit gaussian mixtures model (red line) formed from successive gaussian functions whose means and variances are constrained to be integer multiples of the primary distribution (black lines).