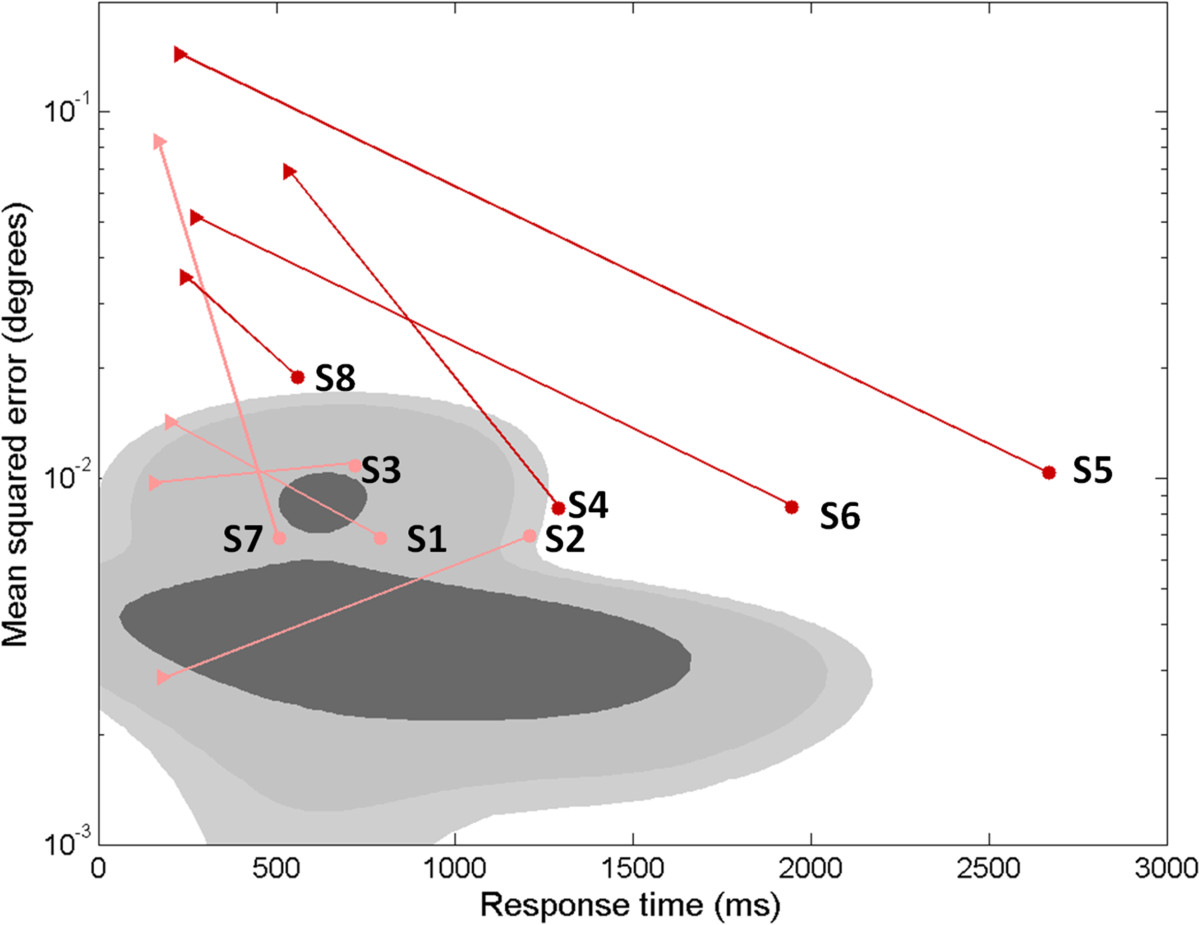
Figure 9.

Steady state error (degrees) vs. response time (ms) during a reach and hold task (step displacement). Shaded regions (dark, medium, and light gray) denote the 50, 90, and 95% confidence intervals estimated from a mixture of Gaussians fit to control subjects’ response across all trials. For subjects with MS, trial-averaged response times and MSEs are shown individually for clarity (filled circles). Dark red symbols denote MS subjects with “high” (>3SD above the control mean) visual delays, and pink symbols denote MS subjects with “low” (<3SD) visual delays. The average best-fit model performance to the same trials is also shown for each subject (filled triangles). Four subjects (all with “low” visual delays) lie within the 95% CI for control subjects. Four subjects (all with “high” visual delays) lie outside the 95% CI for control subjects. In all cases, the best-fit sensory feedback control model for subjects with MS (filled triangles) reacted more quickly to a target perturbation than the subjects’ actual responses (filled circles).
