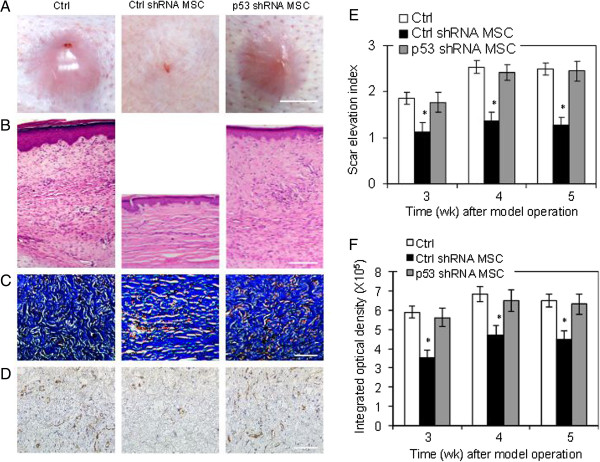
Figure 3.

Role of p53 in mesenchymal stem cell-induced prevention of hypertrophic scar in the rabbit ear model. Representative (A) general observations (scale bar, 5 mm), (B) hematoxylin and eosin staining (scale bar, 500 μm), (C) Masson’s trichrome staining (scale bar, 200 μm), and (D) immunohistochemistry of CD31 (scale bar, 200 μm) of scar sections 4 weeks after model operation from three individual experiments. (E) Scar elevation index (SEI). (F) Integrated optical density analysis of Masson’s trichrome staining. Data expressed as mean ± standard error of the mean, n = 6. *P <0.05 vs. control (Ctrl) group and p53 shRNA mesenchymal stem cell (MSC) group.
