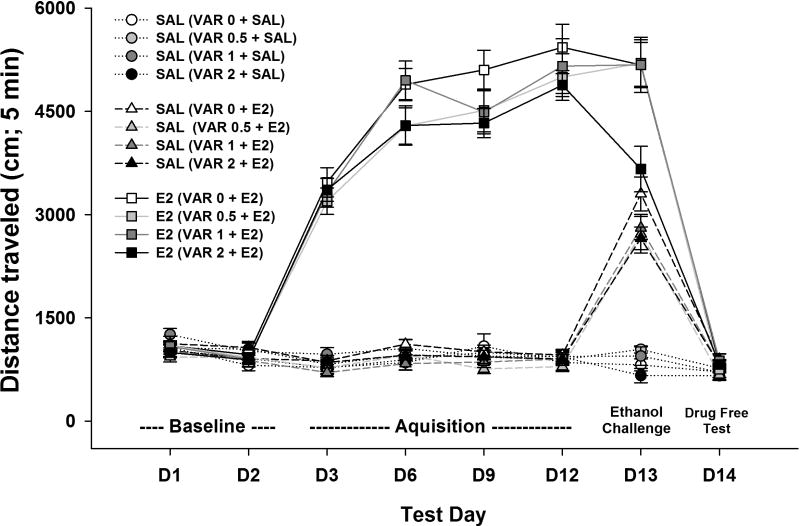
Figure 3.
Locomotor activity levels across test days for the study examining the effect of varenicline on the expression of ethanol-induced locomotor sensitization. Shown are means ± SEM distance traveled in cm during the first 5 min of each 15-min activity session. All mice received only saline (2 injections) on days 1 and 2; groups represented by circles and triangles received only saline on days 3–12 (2 injections); groups represented by squares received saline then ethanol on days 3–12. Treatment of each group on day 13 is indicated within the parentheses (pretreatment + treatment). All mice received only saline (2 injections) on day 14. SAL = 0.9% saline; VARx = varenicline tartrate dose in mg/kg. E2 = ethanol 2 g/kg.

