
Figure 1. Domain organization in GluA2cryst.
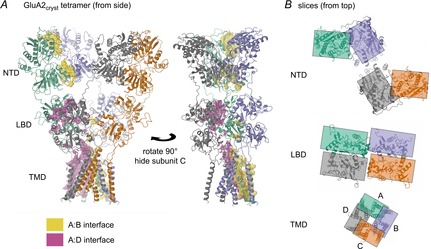
A, the GluA2cryst tetramer (PDB (protein data bank) code 3kg2; Sobolevsky et al. 2009), showing two side-views, rotated 90 deg. Subunits are coloured green (A), blue (B), orange (C) and grey (D). Interfaces between subunit A and neighbouring subunits are shown as magenta (the A:D interface) and yellow (the A:B interface) surfaces. The A:D interface is most visible in the left panel and consists of contacts in the LBD and TMD. The A:B interface is most visible in the right panel and mainly consists of contacts in the NTD and TMD. B, sectional views from above the tetramer, centred on the three main domains. Rectangles indicate the approximate extent of the subunits to show the switch from A:B and C:D contacts in the NTD to A:D and B:C contacts in the LBD. These views also highlight the change from (pseudo) 4-fold to 2-fold symmetry between the TMD and extracellular domains, as well as the right-handed subunit ‘twist’ (moving up from TMD to NTD), which is greatest for the B and D subunits. Structure cartoons in this and other figures were generated using CCP4mg (McNicholas et al. 2011). Interface surfaces were calculated by the PISA service (http://www.ebi.ac.uk; Krissinel & Henrick, 2007) called from within CCP4mg.