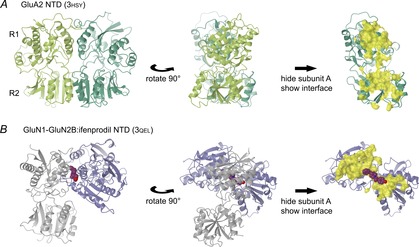
Figure 2. NTD dimer interfaces.

A, views of the GluA2 NTD dimer (PDB code 3hsy; Rossmann et al. 2011). Domains are shown in cartoon representation, with N-terminal residues at the top. The left and central panels show both protomers (light and dark green), with the view rotated 90 deg. The top and bottom lobes of the NTD are commonly designated as R1 and R2, so the interfaces form as R1:R1 and R2:R2. In the right panel only protomer B is shown, along with the interface between A and B (yellow surface) as calculated by PISA from within CCP4mg. B, views of the GluN1–GluN2B NTD dimer in complex with ifenprodil (3qel; Karakas et al. 2011). The Xenopus GluN1 and rat GluN2B protomers (light grey and blue, respectively) and the interface surface are shown as in A. The interface largely consists of R1:R1 interactions. Ifenprodil is shown in purple space-fill. The initial orientation was fixed by aligning protomer A (GluN1) with the equivalent GluA2 protomer, leaving protomer B oriented with R2 pointing towards the viewer in the left panel.
