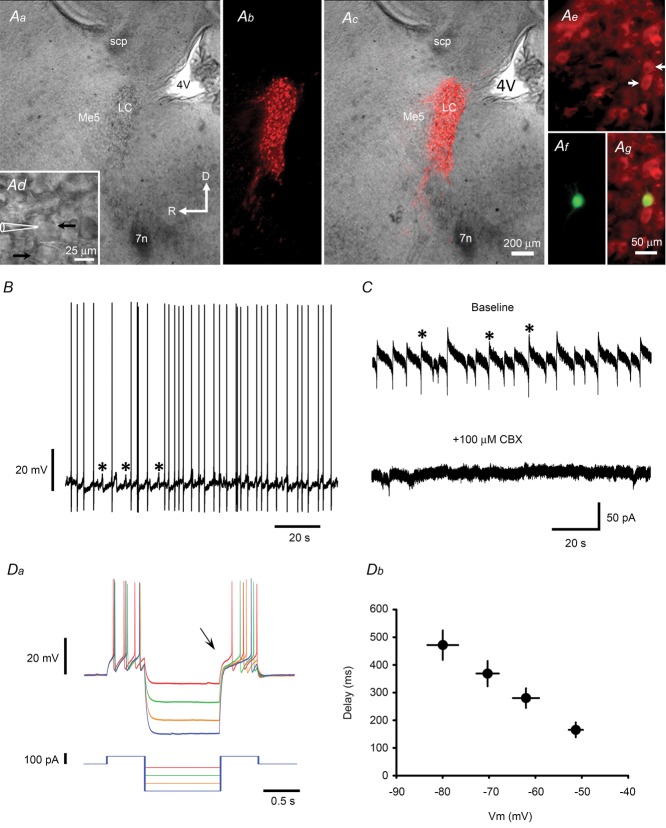
Figure 1. Recordings from LC neurons.
A, identification of LC neurons in a sagittal brainstem slice. Aa and Ad are bright field images showing a paraformaldehyde-fixed slice at low magnification (Aa) and a non-fixed slice at high magnification (Ad). Ab and Ac are fluorescence images of slices stained with anti-TH antibody alone (Ab) or the merged image for Aa and Ab (Ac). Note the dense TH-ir neurons in the LC. Ae–g are fluorescence images of slices stained with anti-TH antibody (Ae) or biocytin (Af) and the merged images (Ag). The TH-ir neurons marked with white arrows in Ae are those marked with black arrows in Ad; the upper neuron was recorded and filled with biocytin (Af and g). Abbreviations: 4 V, 4th ventricle; 7n, 7th nerve; Me5, mesencephalic trigeminal nucleus; scp, superior cerebellar peduncle. The large arrows in Aa indicate slice orientation (D: dorsal; R: rostral) and the scale (200 μm). B, representative current recording from a TH-ir neuron showing spontaneous firing of APs and voltage oscillations (asterisks). C, voltage-clamp recordings from the same neuron as in B showing that the membrane currents underlying the voltage oscillations (asterisks in top trace) are blocked by application of 100 μm CBX, a gap junction blocker (bottom trace). D, representative current-clamp recording showing membrane voltage (Vm) responses (top trace) to the current injection protocol shown in the bottom trace (Da) and the summarized results (Db). Note that the delay in the onset of the action potential after the end of the hyperpolarizing current pulse (see arrow in Da) is Vm dependent (Db).

