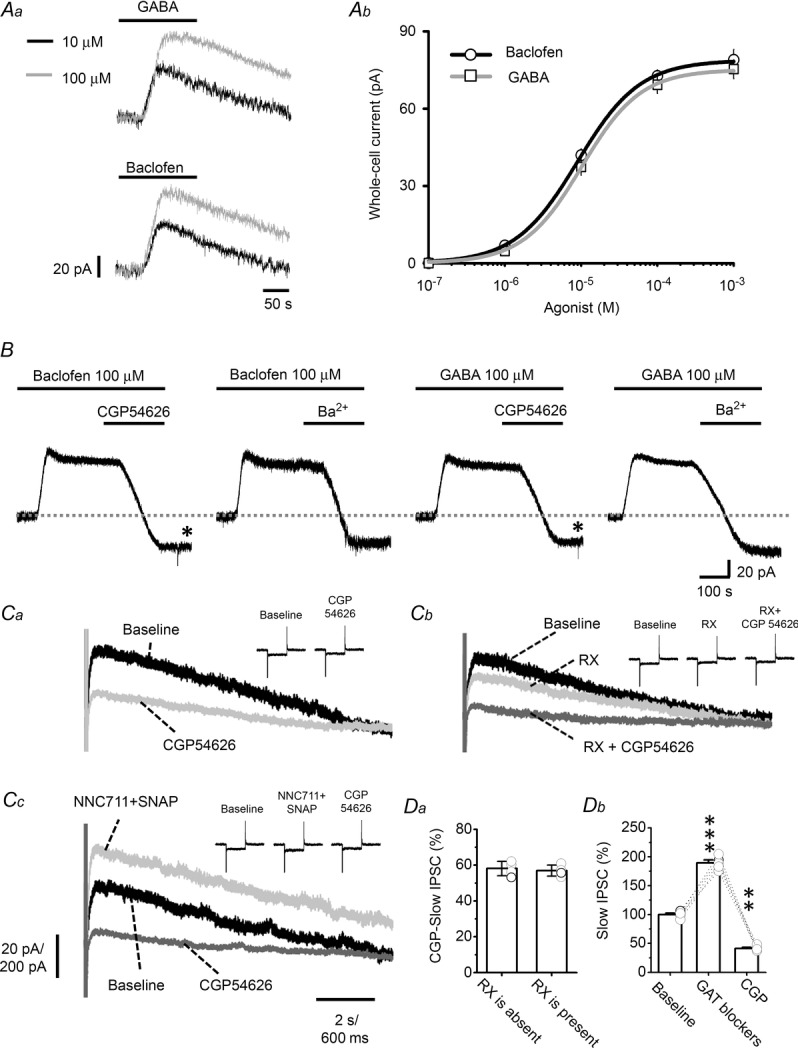
Figure 2. GABABR-GIRK currents in LC neurons.

A, the traces in Aa are representative voltage-clamp recordings of the outward current induced by 10 or 100 μm baclofen or GABA. Ab shows summarized results using baclofen and GABA at concentrations of 0.1, 1, 10 and 100 μm and 1 mm and the fitting of the Hill equation to the data. B, representative recordings showing that the baclofen- or GABA-induced outward current is blocked by subsequent application of 10 μm CGP54626 or 1 mm Ba2+. C, GABABR-mediated slow-IPSCs in LC neurons. Ca, superimposed representative recordings showing the slow-IPSCs evoked in LC neurons by a 5-pulse stimulating train at 50 Hz under baseline conditions and in the presence of 10 μm CGP54626. Cb shows representative recordings of baseline, after addition of 100 nm RX781094 (RX), and after further addition of 10 μm CGP54626. Cc shows representative recording under baseline conditions after addition of two GAT blockers (50 μm NNC711 + 10 μm SNAP), and after further addition of 10 μm CGP54626. Inset traces in Ca–c show monitoring of series resistance by applying 5 mV voltage pulses throughout recording. Note no significant variance of series resistance. The vertical scale is 20 pA and 200 pA for recording of slow-IPSCs and series resistance monitoring, respectively, and the horizontal scale is 2 s and 600 ms for recording of slow-IPSCs and series resistance monitoring, respectively. D, summarized results of recording shown in C. Da shows the percentage blocking by CGP54626 of the slow-IPSCs (CGP slow-IPSC) in normal medium or the addition of the α2 blocker RX. Db shows the effect of GAT blockers on slow-IPSCs. The circles show results of individual experiments and the error bars show the mean and SEM for 4 cells (Da) or 8 cells (Db). The asterisks indicate a significant difference compared to the baseline value at the level of P < 0.01 (**) or P < 0.001 (***) using a paired t test. CGP, CGP54626.
