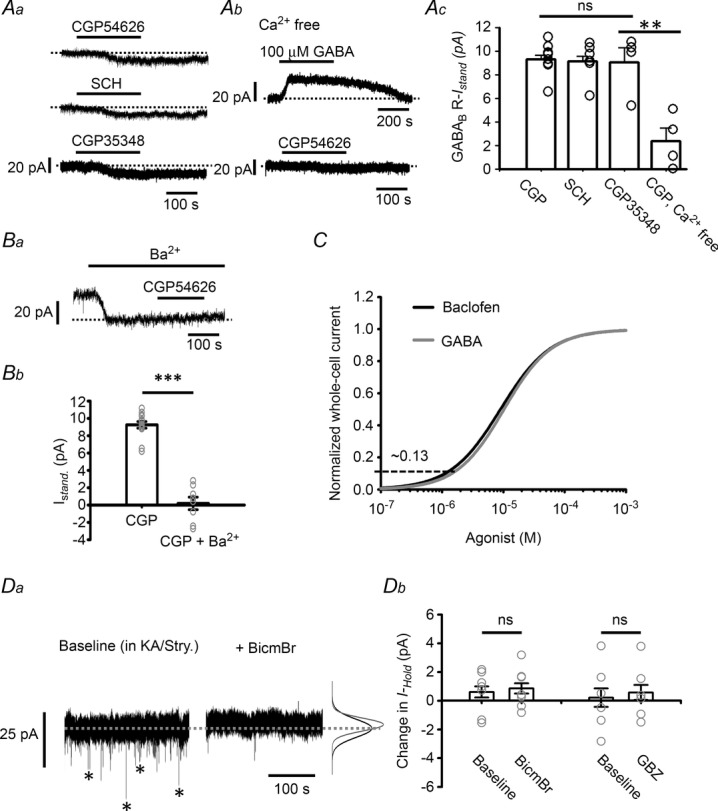
Figure 4. GABABR-IStand in LC neurons.

A, representative recordings showing the GABABR-IStand induced by application of two inverse agonists, CGP54626 and SCH50911, and a neutral antagonist CGP35348 (Aa), the IGABA induced by 100 μm GABA and the GABABR-IStand induced by 10 μm CGP54626 in Ca2+-free medium (Ab), and the summarized results (Ac). CGP, CGP54626. B, induction of the GABABR-IStand by 10 μm CGP54626 in the presence of 1 mm Ba2+; Ba shows a representative recording and Bb the summarized results compared to the values in the absence of Ba2+ (pooled data from CGP and SCH in panel Ac). C, normalization of the whole cell current versus concentration curve induced by GABA (grey) to that for baclofen (black) (data from Fig. 2Ab). The horizontal dashed line indicates the peak amplitude of the GABABR-IStand, which yields an estimate of the percentage of the GABABR-IStand to the GABABR-mediated total whole-cell current. Da, representative recordings of GABAergic mIPSCs (asterisks in the left trace), which are blocked by application of 20 μm BicmBr (right trace). Note that the inhibition of the mIPSC is not associated with a change in the holding current (dashed line) or noise level (indicated by the Gaussian curves on the right; black baseline, grey after BicmBr application). Db, summarized results for the effects of BicmBr and GBZ on the holding current. In all plots, the circles show results of individual experiments, while the error bars are the mean and SEM. ns in Ac and Db indicates no significant difference using one-way ANOVA or the paired t test, respectively, while ** in Ac and *** in Bb indicate, respectively, a statistically significant difference at the P < 0.01 and P < 0.001 level using Student's t test.
