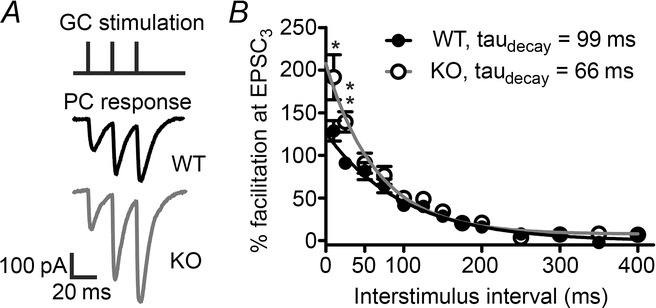
Figure 6. Increased PPR in KV10.1 KO cells.

A, 50 Hz stimulus train (top) with representative recordings from a WT (middle) and KV10.1 KO (bottom) PC. The traces shown are the average of ten sweeps each, and stimulus artefacts have been blanked for clarity. B, facilitation of the third EPSC plotted against the interstimulus interval. The amplitude of facilitation decays exponentially with a time constant of 99 ms in the WT (filled circles) and 66 ms in the KO (open circles). Note the significant differences at intervals < 50 ms (P ≤ 0.05, Student’s t test).
