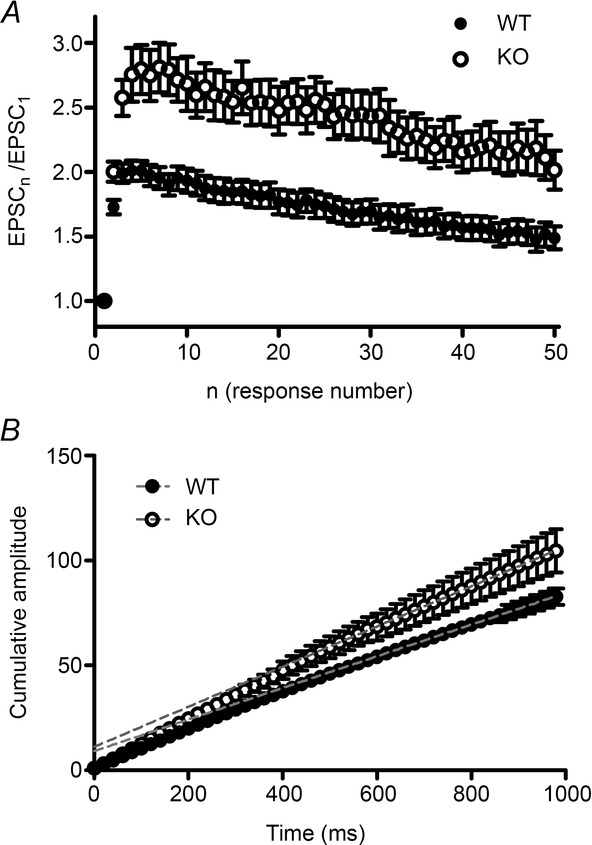
Figure 8. Facilitation during prolonged stimulation.

A, normalized EPSC amplitude (EPSCn/EPSC1) during 50 Hz stimulation at the PF–PC synapse plotted against response number. Facilitation decays only slowly in both genotypes (filled circles, WT; open circles, KO). B, cumulative plot of normalized EPSC amplitudes shown in A. A line is fitted to the steady-state region of the plot (dotted red line, WT; dotted blue line, KO) and extrapolated to intercept the y-axis at time 0. The slope represents the relative replenishment rate of the RRP (Schneggenburger et al., 1999, 2002). The fitting function is 0.076t + 9.06 for the WT, and 0.096t + 11.06 for the KV10.1. filled circles, WT (n = 24); open circles, KO (n = 19).
