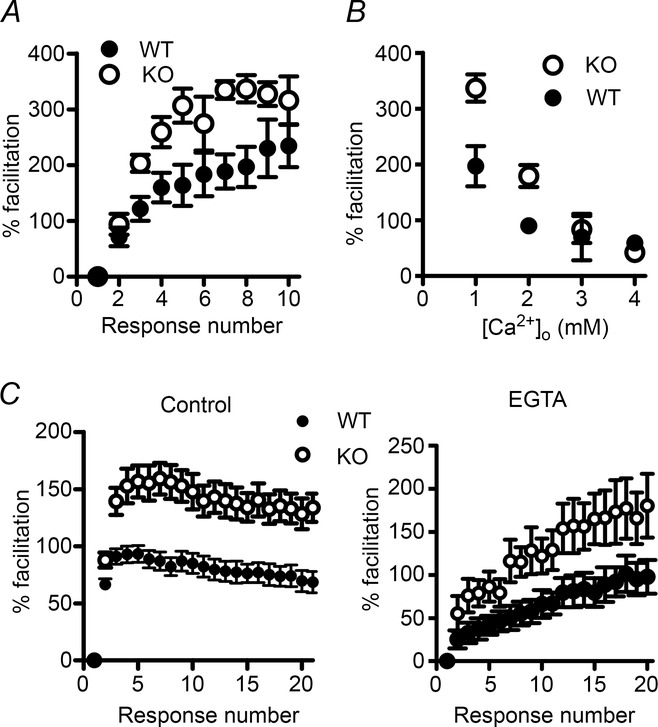
Figure 9. The effects of altering extracellular or intracellular calcium on facilitation at the PF–PC synapse.

A, response to 50 Hz train stimulation in 1 mm external Ca2+. B, percentage facilitation at the 8th EPSC of a 50 Hz train, when facilitation reached a plateau. Open circles, KV10.1 KO; filled circles, WT. Each data point is the average of 5–10 cells. C, response to a 50 Hz stimulus under control conditions (left) and after incubation with 50 μM EGTA-AM (right). Both amplitude and time course are changed after incubation with EGTA-AM. Facilitation in the KO (open circles) was increased and rose faster than in the WT (filled circles).
