
Figure 2. hCSF lowers the threshold for action potential firing in CA1 pyramidal neurons.
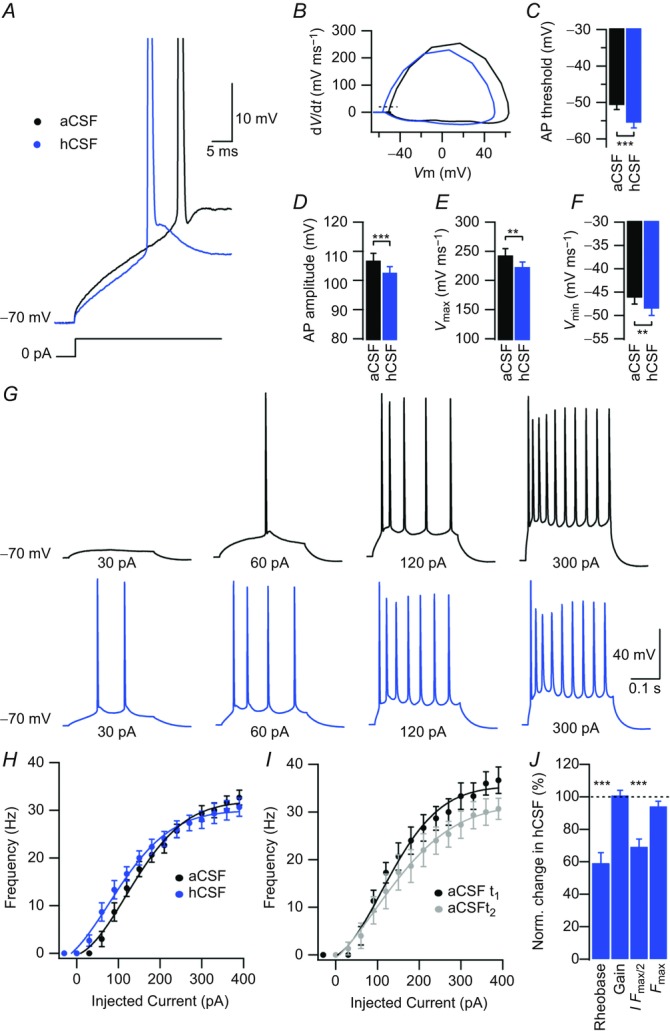
A, example sweeps of APs in aCSF and hCSF evoked by a 300 ms depolarizing current pulse from a Vm of –70 mV. Sweeps are expanded in time and show first APs evoked by depolarizing current injection. B, phase plane plot of the APs shown in A, with aCSF in black and hCSF in blue. Dashed line shows threshold as defined by a dV/dt of 20 mV ms–1. C, summary bar graph showing the AP threshold in aCSF and hCSF. D, summary bar graph showing AP amplitude in aCSF and hCSF. E, summary bar graph showing maximal AP upstroke velocity in aCSF and hCSF. F, summary bar graph showing maximal AP downstroke velocity in aCSF and hCSF. G, example sweeps showing AP output in aCSF (black) and hCSF (blue) in response to depolarizing current pulses of increasing magnitude as indicated. H, frequency–current relationship in aCSF (black) and hCSF (blue). I, control experiment showing rundown of frequency–current relationship over time; t1 (black) corresponds to time point of aCSF recording (H, black) and t2 (grey) to time point of hCSF recording (H, blue). J, summary bar graph showing normalized change in rheobase, gain, I Fmax/2 and Fmax in hCSF. Data were extracted from frequency–current experiments summarized in H. Error bars represent SEM. ∗∗P < 0.01; ∗∗∗P < 0.001.