
Figure 3. Intracellularly applied GTPγS occludes the excitability-increasing effect of hCSF on CA1 pyramidal neurons.
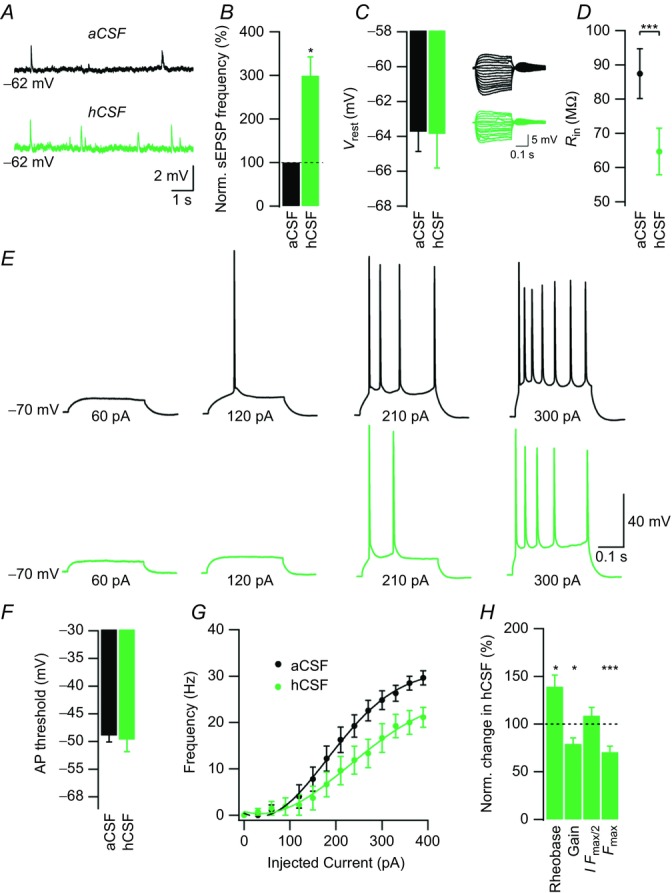
A, example sweeps of current-clamp recordings in aCSF and hCSF at Vrest. B, summary bar graph showing normalized effect of hCSF on sEPSP frequency. C, summary bar graph showing Vrest in aCSF and hCSF. D, example sweeps of voltage responses to a series of current pulses (cf. Fig. 1H) in aCSF (black sweeps) and hCSF (green sweeps) from a Vm of –70 mV. Summary graph showing Rin in aCSF and hCSF. E, example sweeps showing AP output in aCSF (black) and hCSF (green) in response to depolarizing current pulses of increasing magnitude as indicated. F, summary bar graph showing the AP threshold in aCSF and hCSF. G, frequency–current relationship in aCSF (black) and hCSF (green). H, summary bar graph showing normalized change in rheobase, gain, I Fmax/2 and Fmax in hCSF. Data were extracted from frequency–current experiments summarized in G. Error bars represent SEM. ∗P < 0.05; ∗∗∗P < 0.001.