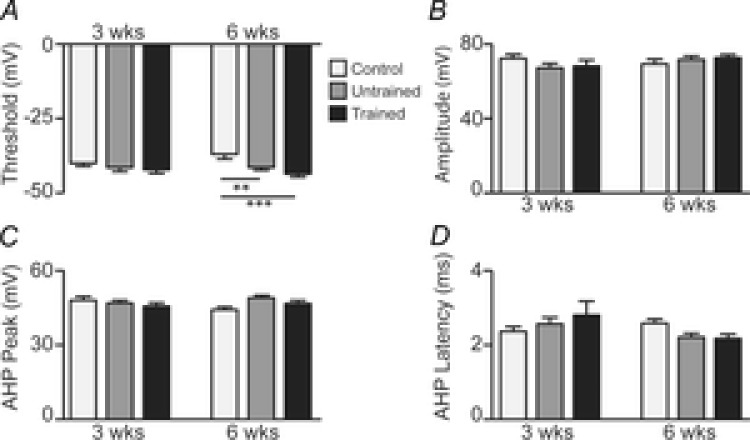
Figure 3. Active intrinsic membrane properties in uninjured age-matched controls and untrained and trained SCI mice.

A–D, bar plots comparing mean ± SEM values for four active intrinsic membrane properties (A, threshold; B, peak amplitude; C, AHP peak; D, AHP latency) in 3 weeks controls and (light grey bars; n = 44 neurons), untrained (dark grey bars; n = 45) and trained (black bars; n = 44) SCI mice and in 6 weeks controls (n = 39), and untrained (n = 66) and trained (n = 61) SCI mice. Significance obtained from two-way ANOVA comparison: **P < 0.01, ***P < 0.0001.
