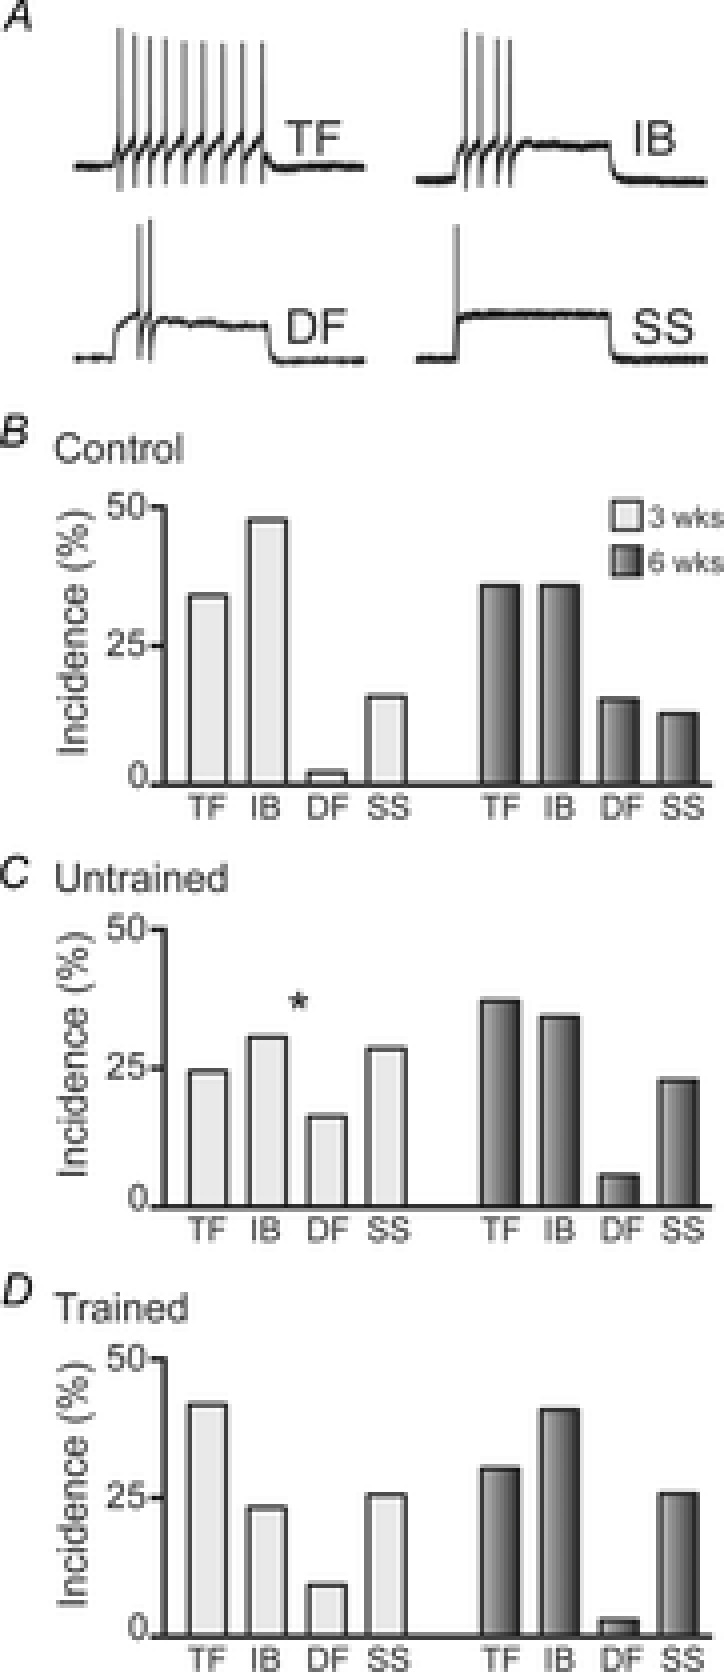
Figure 4. Incidence of AP discharge patterns in controls and untrained and trained SCI mice.

A, representative traces showing each of the four distinct AP discharge patterns exhibited by DDH interneurons in response to a 800 ms square step depolarising current injection: tonic firing (TF), initial bursting (IB), delayed firing (DF) and single spiking (SS). B, group data showing the incidence of each of the four AP discharge patterns in age-matched uninjured control animals for the 3 weeks (light grey bars, n = 44 neurons) and 6 weeks (dark grey bars, n = 39) time points. C, incidence of AP discharge patterns in untrained SCI animals at 3 weeks (light grey bars, n = 49) and 6 weeks (dark grey bars, n = 70) time points. D, incidence of AP discharge patterns in trained SCI animals at 3 weeks (light grey bars, n = 43) and 6 weeks (dark grey bars, n = 66). *P < 0.05 for 3 week untrained group compared to 3 week control group. Significance obtained using χ2 test.
