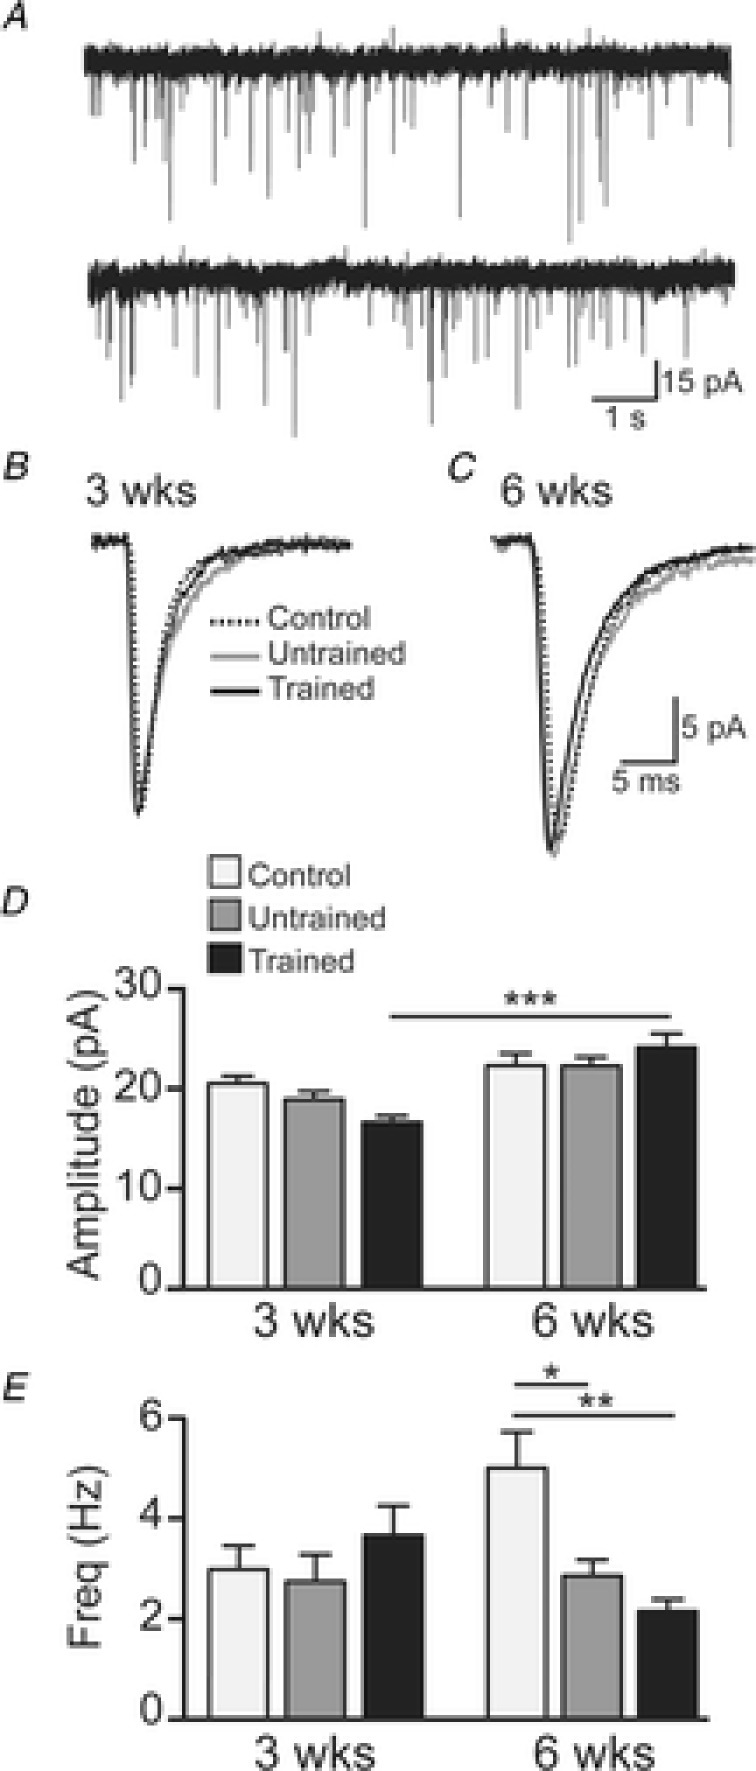
Figure 6. Properties of spontaneous excitatory postsynaptic currents (sEPSCs).

A, representative trace showing sEPSCs recorded in a 6 weeks trained SCI mouse (holding potential −60 mV). Traces shown are two 10 s epochs of continuous data. B and C, example sEPSCs (averaged from all events in 180 s of data) from 3 weeks and 6 weeks controls (black dotted line), and untrained (grey continuous line) and trained (black continuous line) SCI mice. D, group data (mean ± SEM) of sEPSC amplitude for 3 weeks controls (n = 52 neurons), and untrained (n = 46) and trained (n = 49) SCI mice and in 6 weeks controls (n = 45), and untrained (n = 63) and trained (n = 70) SCI mice. E, group data (mean ± SEM) of sEPSC frequency for 3 weeks controls (light grey bars; n = 52), and untrained (dark grey bars; n = 43) and trained (black bars; n = 54) SCI mice and in 6 weeks controls (n = 46), and untrained (n = 64) and trained (n = 72) SCI mice. Significance obtained from two-way ANOVA comparison: *P < 0.05, **P < 0.001, ***P < 0.0001.
