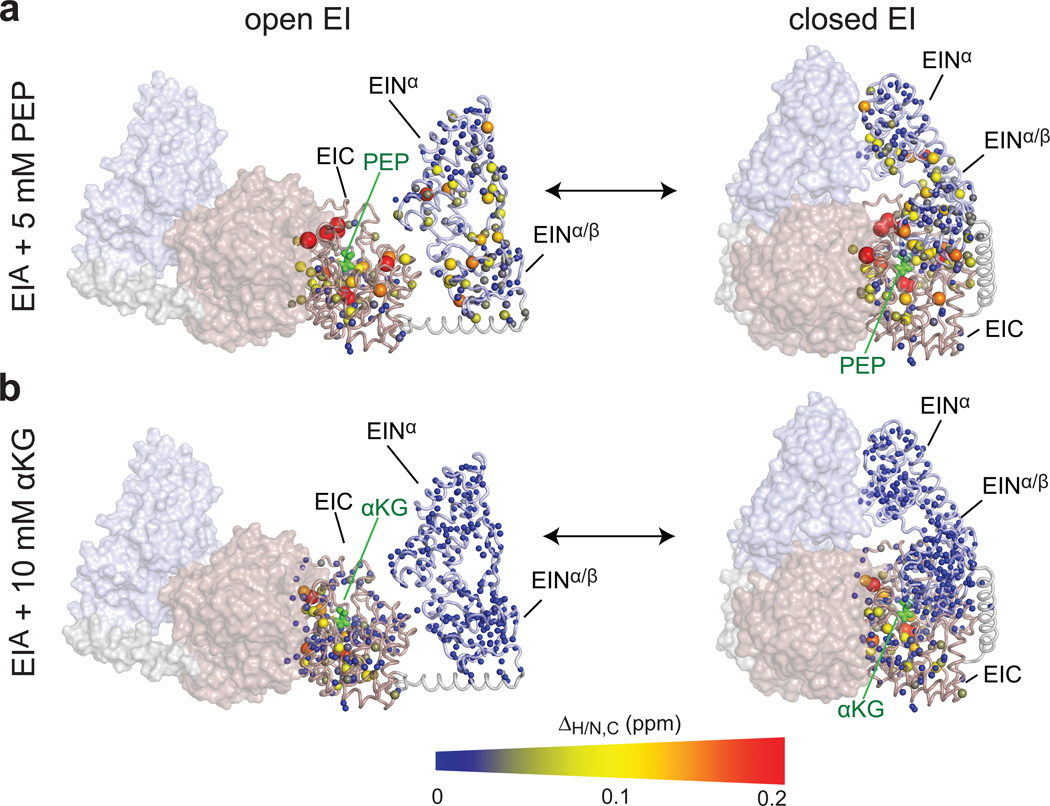
Figure 2. NMR analysis of the EI-PEP and EI-αKG complexes.
Weighted combined chemical shift perturbations (ΔH/N,C) induced by (a) PEP and (b) αKG on the 1H-15N and 1H-13Cmethyl TROSY correlation spectra of EIA displayed on the structure of EI as spheres with the relationship between size and color of each sphere and chemical shift perturbation depicted by the color bar. ΔH/N,C values are displayed on one subunit of the EI dimer. The second subunit is shown as a transparent surface. The EIN and EIC domains are colored light blue and pink, respectively. PEP and αKG bound to one subunit of EI are shown as green sticks. Plots of of chemical shift perturbations as a function of residue for EIWT, EIQ and EIA are shown in Supplementary Fig. 1.

