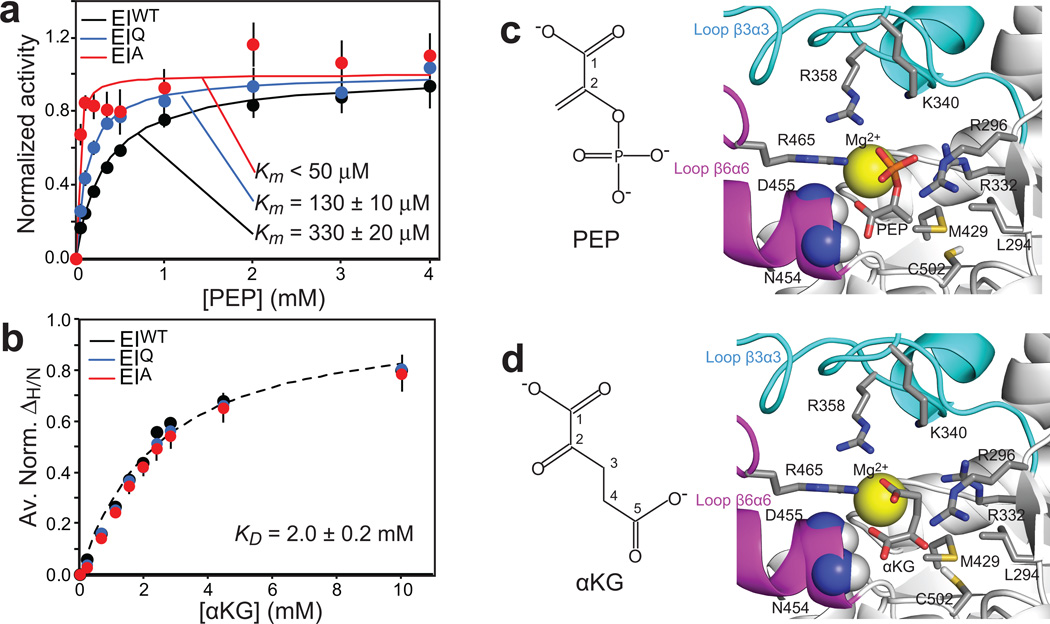
Figure 5. Effect of mutations at position 189 on the affinity of EI for PEP and αKG.
(a) Michaelis-Menten kinetics for EIWT (black), EIQ (blue) and EIA (red) with the substrate PEP. Experimental velocities were normalized to the maximum velocity obtained by the individual fits (solid lines). (b) ΔH/N values for EIWT (black), EIQ (blue) and EIA (red) as a function of αKG concentration. Data for all residues showing ΔH/N > 0.1 ppm at 10 mM αKG were fit simultaneously using a one-site binding model per subunit (see Methods). The 3 datasets can be fit with the same KD value (dashed line). In the figure, the ΔH/N values were normalized respect to the fitted ΔH/N at saturation and averaged out over all the residues used in the fitting procedure. The error bars are set to one standard deviation. (c,d) Structural models of PEP17 and αKG8, respectively, bound to the EIC domain. Ligands and side chains involved in the interactions are shown as sticks (carbon, grey; nitrogen, blue; oxygen, red; phosphorus, orange; sulfur, yellow). Backbone amides of N454 and D455 are shown as sphere (nitrogen, blue; hydrogen, white). The magnesium ion is displayed as a yellow sphere. β3α3 and β6α6 loops are colored cyan and pink, respectively (note that both β3α3 and β6α6 loops contain a short α-helical region). The molecular structures of PEP and αKG are shown on the left. (error bars: 1 s.d.)

