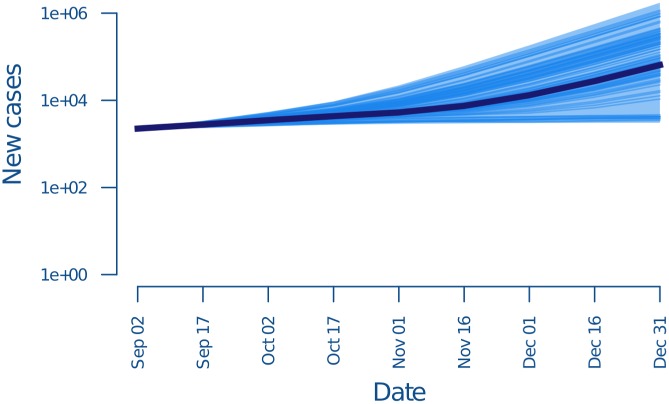
Figure 6. Number of cases in each infection generation when transmission occurs at the baseline rate as predicted by the data available by September 2014.
Dark blue lines show 100 realizations of the stochastic model. Shaded region shows 95% quantiles over 10,450 realizations; x-axis is the final date of the infection generation, e.g., 17 September is for all cases in the infection generation beginning 2 September. The underlying data and code to generate this figure may be obtained by running the file “ebola-forecasting-main-text.R” deposited in the Dryad repository: http://doi.org/10.5061/dryad.17m5q.

