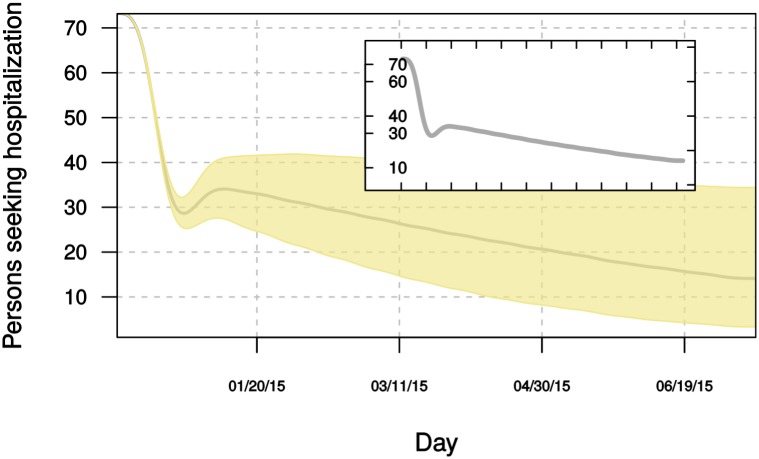
Figure 7. Projected daily hospital demand in 2015 for Ebola patients in Liberia if hospitalization rates are the same as in July–September Summer 2014.
Gray line and inset plot show the median daily number of cases. The underlying data and code to generate this figure may be obtained by running the file “ebola-forecasting-main-text.R” deposited in the Dryad repository: http://doi.org/10.5061/dryad.17m5q.

