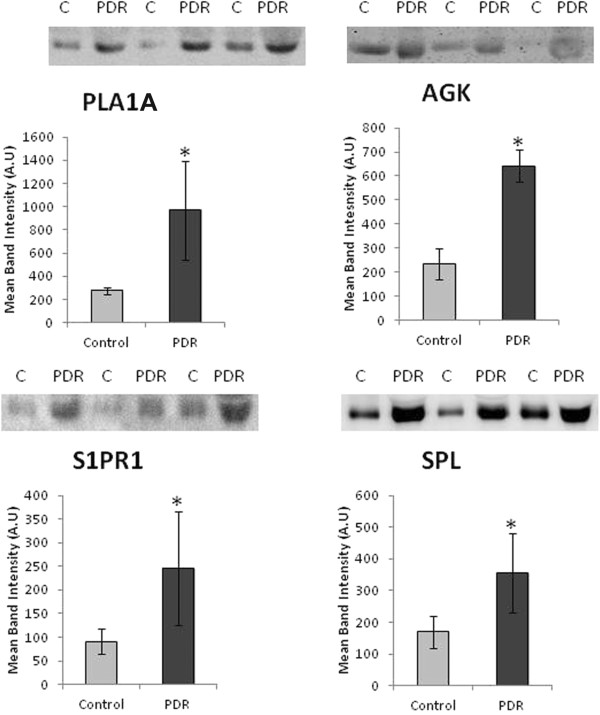
Figure 3.

Comparisons of mean band intensities for phospholipase A1A (PLA1A), acylglycerol kinase (AGK), sphingosine-1-phosphate receptor 1 (S1PR1) and sphingosine-1-phosphate lyase (SPL) in vitreous samples from proliferative diabetic retinopathy (PDR) patients (n = 16) and nondiabetic control patients (n = 16). A representative set of samples is shown. The difference between the two means was statistically significant at 5% level of significance.
