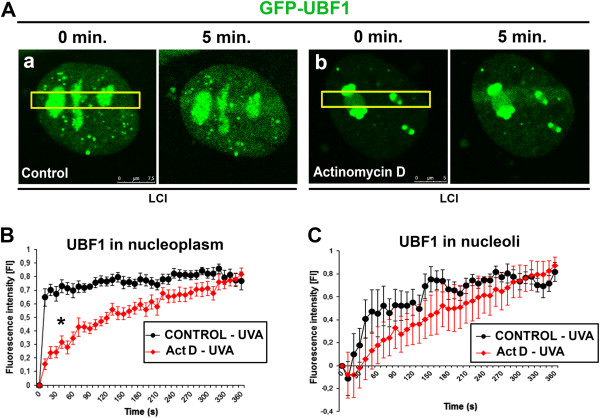
Figure 3.

Fluorescence intensity of GFP-UBF1 after UVA irradiation in non-treated and actinomycin D-treated cells. (A) Recruitment of GFP-UBF1 to UVA-induced DNA lesions in regions of interest (yellow) of (a) non-treated cells and (b) actinomycin D-treated cells. Images show normalized intensity of GFP-UBF1 fluorescence in UVA-induced DNA lesions in iMEFs treated with actinomycin D and non-treated iMEFs. Fluorescence intensity was measured for GFP-UBF1 in (B) irradiated nucleoplasm and (C) irradiated nucleoli. Approximately 40 nuclei were analyzed for each control and actinomycin D-treated cells. LCI, live-cell image.
