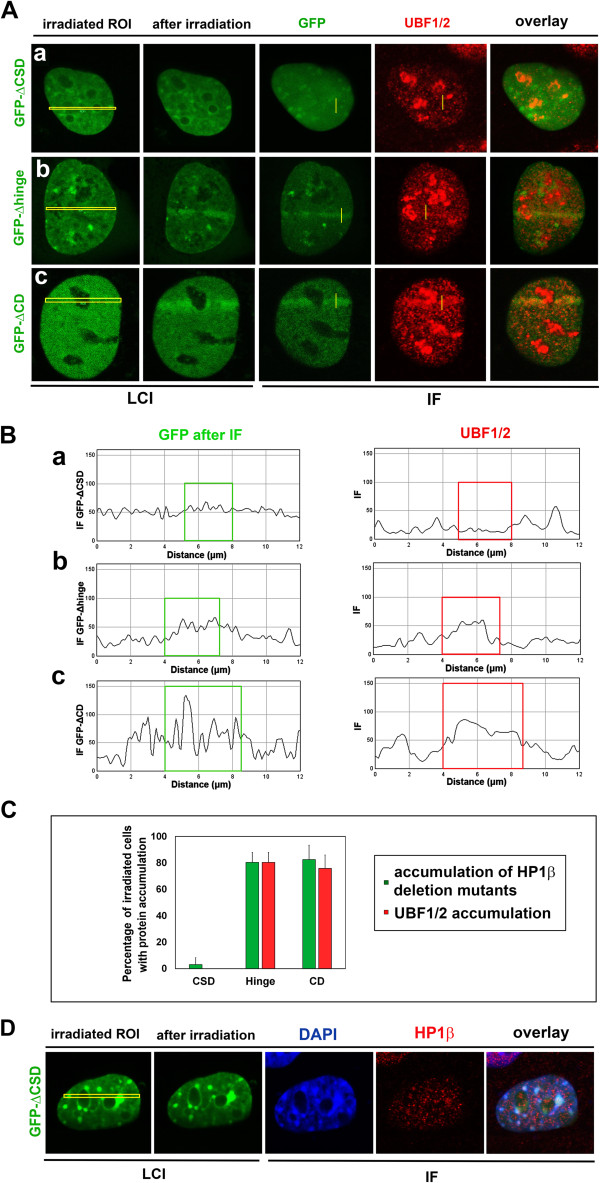
Figure 6.

Functional analysis of HP1βΔCSD, HP1βΔhinge, and HP1βΔCD for UBF1 recruitment to UVA-induced DNA lesions. (A) Analysis of endogenous UBF1/2 (red) recruitment to UVA-induced DNA lesions (yellow regions of interest) in MEFs transiently expressing (a) GFP-HP1β-ΔCSD, (b) GFP-HP1β-Δhinge, or (c) GFP-HP1β-ΔCD (all green). (B) Quantification of fluorescence intensity of UBF1/2 (red) and HP1β (green) from panel A. Quantification was performed for (a) GFP-HP1β-ΔCSD, (b) GFP-HP1β-Δhinge, and (c) GFP-HP1β-ΔCD (all green). (C) Percentage of cells with recruitment of studied proteins to DNA lesions. Thirty cells were analyzed for each event in three independent experiments. (D) Analysis of endogenous HP1β (red) at UVA-induced DNA lesions (yellow regions of interest ) in mouse embryonic fibroblasts transiently expressing GFP-HP1β-ΔCSD (green). For panel D, 20 nuclei were analyzed. CD, chromodomain; CSD, chromo shadow domain; IF, immunofluorescence; LCI, live-cell image.
