
Figure 1.
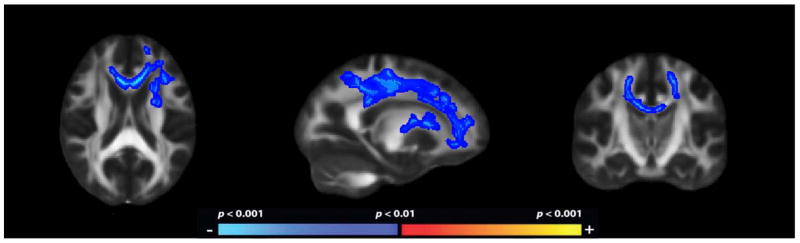
Fractional anistropy maps demonstrating decreased regional WM microstructure in ALC as compared to NC. The heat scale represents statistical p values as described in the figure color scale-bar. Reductions in FA in were bilateral and widespread throughout the cerebral WM.