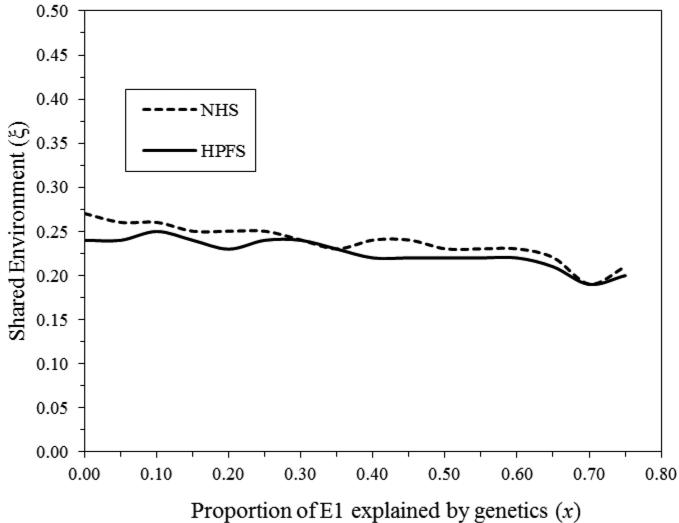
Fig. 3.
Parental shared environment under simulation models with varying proportions of E1 explained by genetics (x). σG12=0.03, σE12=0.18, σG22=0.37, σE22=0.42. E1 is partitioned into a genetic component E1G (σE1G2=σE12(x)) and an environmental component E1E (σE1E2=σE12 -σE1G2), where x ranges from 0.0 to 0.75 with 0.05 increments.

