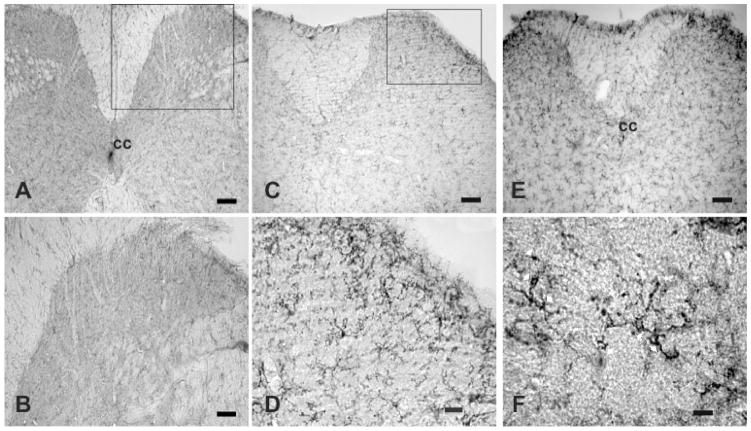
Fig. 1.
Distribution of CD11b immunoreactive cells in cervical segments from mice injected with saline, compound 48/80 or GNTI A and B, a lower and higher magnification of a cervical spinal segment from a mouse injected with saline; lightly labeled, small CD11b cells with fine cell processes are seen in the gray and white matter. C and D, a lower and higher magnification of a cervical spinal segment from a mouse injected with compound 48/80 (50 μg/100 μl) where strongly labeled, hypertrophic cells with stout cell processes densely distributed to the dorsal horn. E, a lower magnification of a cervical segment from a mouse injected with GNTI (0.3 mg/kg); numerous strongly labeled, hypertrophic cells with stout cell processes are distributed to the dorsal horn. F, a high magnification illustrating several strongly labeled irCD11 cells with stout cell processes, as indicated by white arrows. cc, central canal. Calibration bar: A, C and E, 100 μm; B and D, 50 μm; F, 10 μm.

