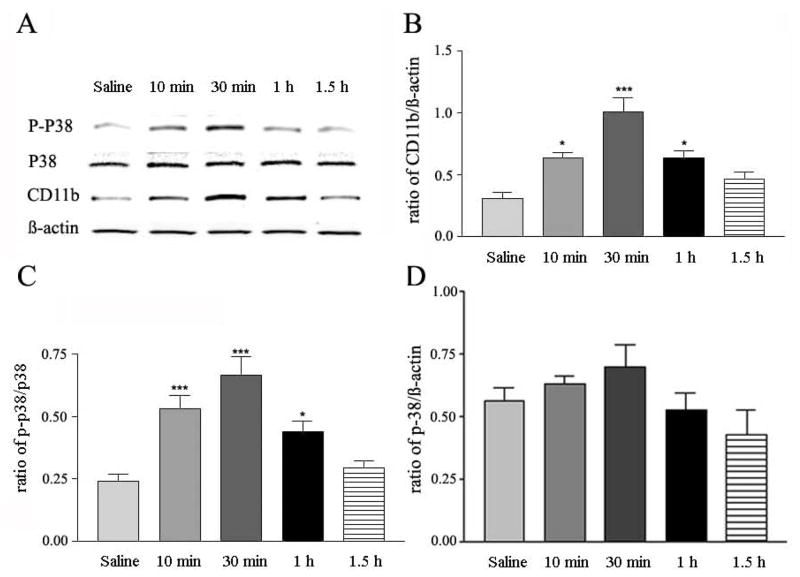
Fig. 3.
Time course of GNTI-induced changes in CD11b, p-p38 and p38 expression in mouse spinal cords. A, representative Western blot of CD-11b, p-p38, p38 and β-actin, induced by GNTI (0.3 mg/kg) or saline at 10, 30, 60 and 90 min post injection. B, C and D, histograms of ratios of CD11b/β-actin, p-p38/p38, p-38/ β-actin induced by saline or GNTI (0.3 mg/kg). Mean ± SEM values are derived from 5 independent assays; *p <0.05, and ***p < 0.001.

