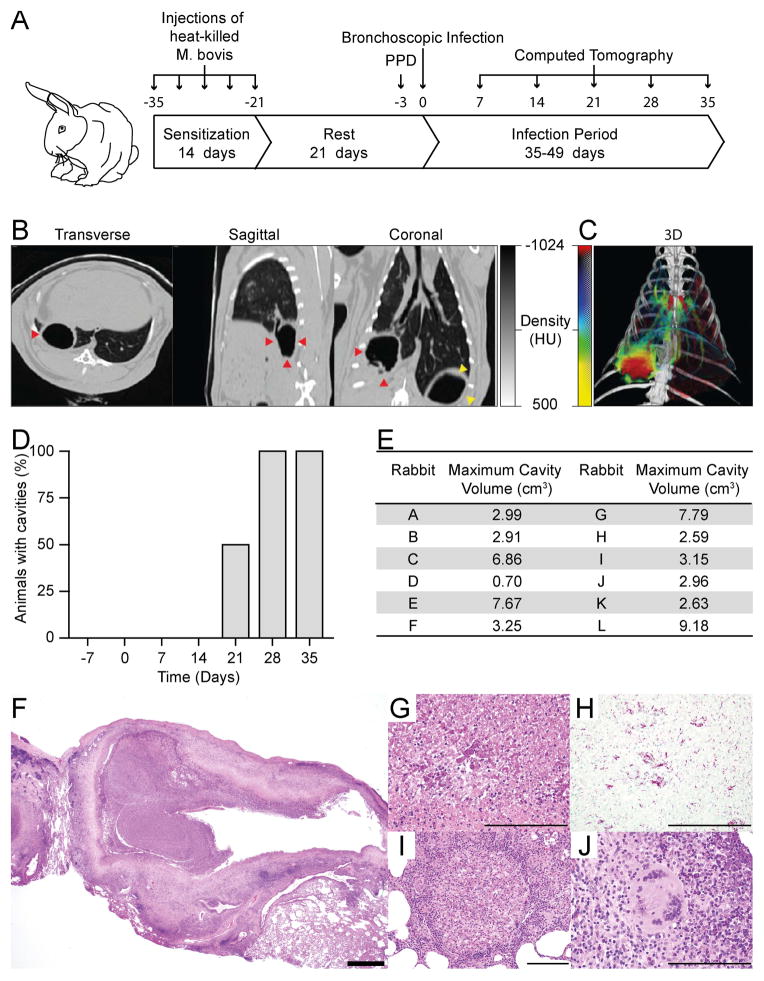
Figure 1. A reproducible model of TB which demonstrates human-like pathology and cavity formation within 28 days.
(A) Sensitization and infection protocol: Rabbits were sensitized by administering 5 injections over 14 days, each containing 108 heat-killed CFU of M. bovis strain Ravenel. After 21 days, PPD testing was performed to confirm the development of delayed-type hypersensitivity to M. tuberculosis complex antigens. Infection with 103 CFU of M. tuberculosis was then performed 3 days after PPD testing under bronchoscopic guidance. The animals were monitored by serial CT imaging and then humanely sacrificed at pre-determined time points. See methods for detailed description. (B) Representative CT scan of a rabbit with a cavity. Red arrows indicate the cavity, while yellow arrows indicate gastric air. (C) A 3D-reconstruction of a representative animals scan using a customized scale in which low density regions (cavities and airways) are represented in red, and high density regions (blood vessels and consolidation) in a green to yellow scale where yellow regions are more dense. (D) Proportion of animals with cavities at each time point as assessed by CT scan (n=12). (E) Cavity size was assessed using an automated cavity segmentation algorithm [ref. 45]. Maximum cavity sizes for each animal are shown. (F–J) H+E stained slides of rabbit lung tissue demonstrating all the pathognomic features of human TB: (F) Low power image of cavity, with air-filled center, necrotic rim and a peripheral fibrotic cuff. (G) Necrotic debris at cavity surface (H) Ziehl-Neelsen staining demonstrates numerous bacteria within necrotic debris (I) Small cellular granuloma without central caseation (J) Multinucleate giant cell within granuloma. (Scale bars; F 1mm, G–J 200μm. HU = Hounsfield units).

