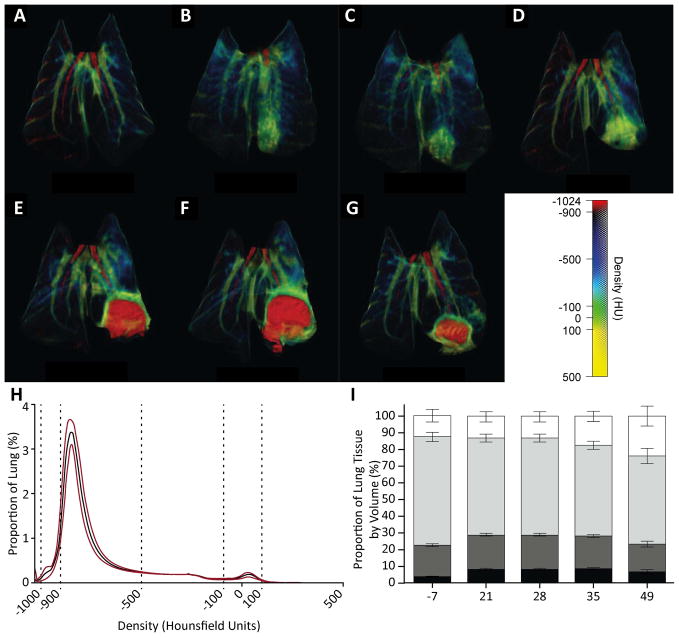
Figure 4. 3-dimensional false-color reconstruction of CT images demonstrates disease progression over time.
(A–G) Serial imaging of a single, representative rabbit over 49 days. Day 7 and 14 are non-anesthetized, non-breath-hold scans, all others are breath-hold scans with the lungs inflated to 20cmH2O inflation. (H) Proportional distribution of pulmonary tissue by density when inflated to 20cmH2O of pressure demonstrates highly reproducible density spectrum (n=54). Black line represents mean density and red lines represent standard deviation. (I) Proportional distribution of voxels inflated to 10cmH2O, grouped by tissue type derived from Hounsfield Units (HU). (Black, not inflated, −100 to 100HU; Dark Grey, poorly aerated, −101 to −500HU; light grey, normally aerated, −501 to −900HU; white, hyperexpanded, −901 to −1000HU. Error bars represent standard deviations).

