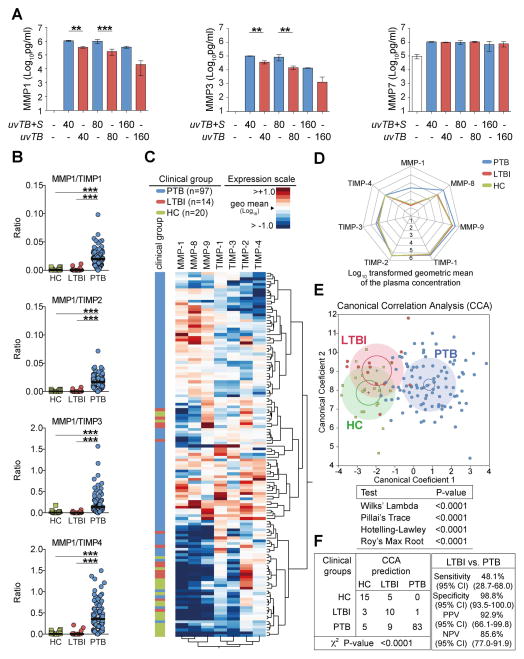
Figure 6. MMP/TIMP imbalance in humans.
(A) MMP-1/-3 and -7 levels were measured in supernatant from human monocyte derived macrophages infected with UV-killed M. tuberculosis in the presence or absence of released bacterial products. (B) Plasma concentrations of several MMPs and TIMPs were assessed by ELISA in samples from ATT-naïve active pulmonary TB patients (PTB, n=97), individuals with latent TB infection (LTBI, n=14) and age and gender matched healthy controls (HC, n=20). The ratio between levels of MMP-1 and each one of the TIMPs are shown. (C) An unsupervised two-way clustering analysis (Ward’s method) was employed using the plasma concentrations of each MMP and TIMP. Individuals from the PTB, LTBI or HC groups were listed in rows and each biomarker was placed in a different column. The squares in the heat map represent values below or above the geometric mean values (log10 transformed) of a given biomarker in the entire study population (n=131), with dark red indicating an increase in expression and dark blue a decrease. (D) A representative profile of geometric mean values (log10 transformed) for MMPs and TIMPs in plasma is shown for each clinical group. (E) The performance of the combined assessment of plasma concentrations of several MMPs and TIMPs in distinguishing the different clinical groups was tested using a Canonical Correlation Analysis (CCA) model. The statistically significance of the CCA model was tested using standardized tests and P values for each one of them is shown. Small circles represent the 95% confidence region to contain true mean of each group whereas large shaded ellipses represent region estimated to contain 50% of the population of each group. (F) The performance of the CCA model in distinguishing the different clinical groups as well as details of sensitivity, specificity and predictive values of the test distinguishing PTB form LTBI are shown. In (B), data were analyzed using Kruskal-Wallis test with Dunn’s multiple comparisons post hoc test. In F, data was analyzed using chi-square (left panel) and the Fisher’s exact tests (right panel) ***P<0.0001; CI, confidence interval.

