Figure 2.
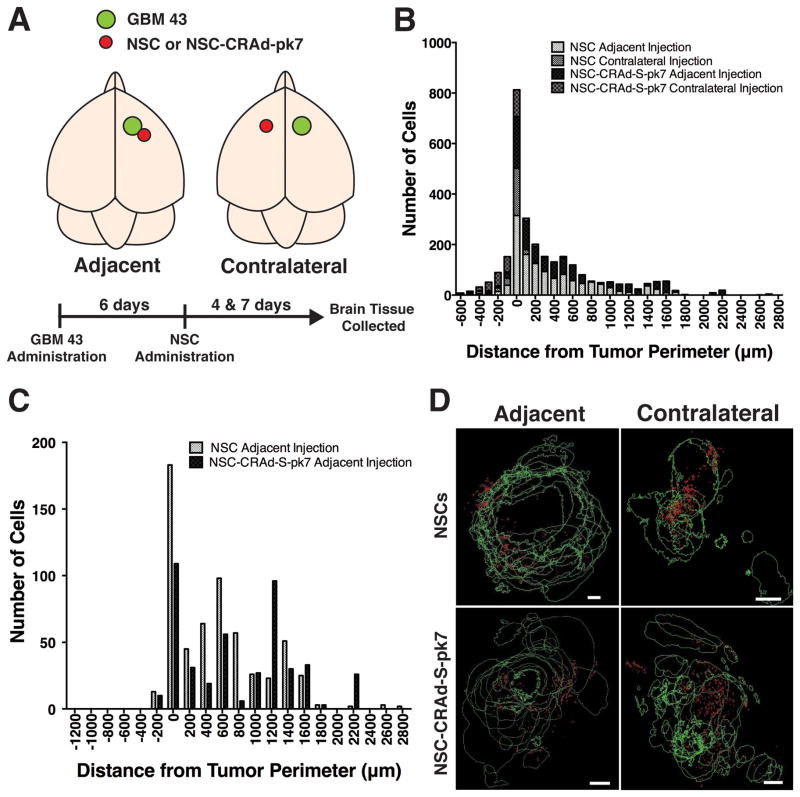
Quantitative analysis and visualization of NSC and NSC-CRAd-S-pk7 distribution within the tumor vicinity. A) Schematic of experimental design: athymic nude mice were administered GBM 43 cells into the right hemisphere with administration of stem cells either adjacent to or in the contralateral cortical hemisphere to the established GBM43 tumor. B) Histogram of NSCs or NSC-CRAd-S-pk7 distribution after either adjacent or contralateral injection. Cells were found to be distributed mostly at or adjacent to the tumor border (negative values = within tumor; positive values = outside tumor). C) Comparison of NSC and NSC-CRAd-S-pk7 distribution at day 4 after adjacent administration revealed no difference (n = 18 per group; K-S test; p=0.97). D) Reconstruction of tumor area and stem cell location from brain tissue sections collected on day 4. The majority of stem cells were distributed around the periphery of tumors. Scale bars = 200 μm.

