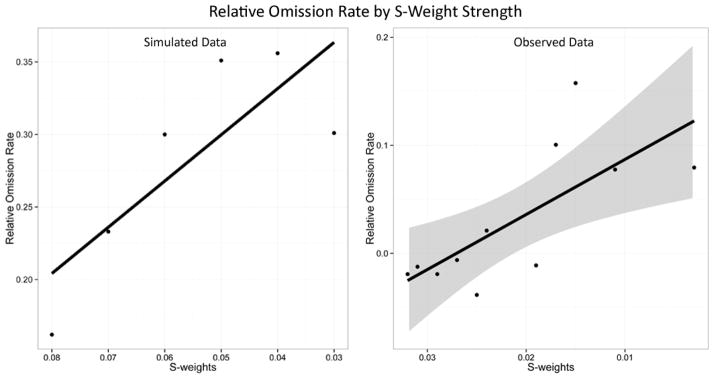
Figure 5.

Relationship of s-weight strength on relative omission error rates, with simulated results (left panel) and observed results (right panel). Error band in the behavioral graph corresponds to 95% confidence interval around the linear fit line.
