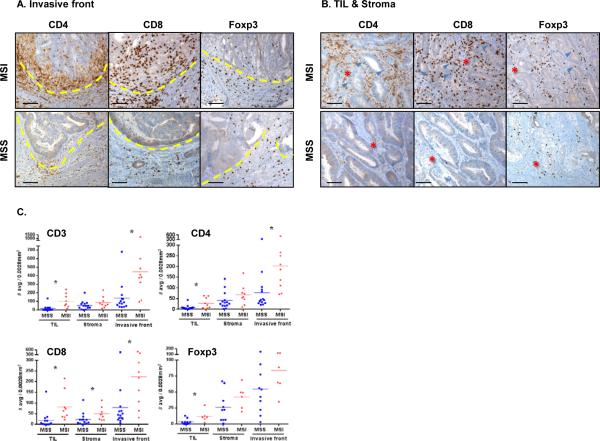
Figure 1. Geographic distribution in situ of MSI and MSS CRC-infiltrating lymphocytes.
FFPE tissue sections were characterized by IHC for CD4+, CD8+ and Foxp3+ cell infiltration. Three distinct histological areas designated as tumor infiltrating lymphocytes (TIL), tumor stroma and invasive front (where tumor invaded normal lamina propria) were histologically identified and separately analyzed. Invasive front (A) and TIL/Stroma (B) areas of a representative MSS (bottom panel) and MSI (top panel) are shown (20X magnification). Dashed lines in (A) delineate the invasive front with the tumor tissue on the top side and the normal tissue on the bottom side. Red stars and blue arrows in (B) indicate the tumor stroma and tumor epithelium-infiltrating immune cells, respectively. Scale bars, 100μm. C, cell density was scored in 14 MSS (blue) and 9 MSI (red) specimens by determining the average number of stained cells in 5 distinct hpf (0.0028mm2/hpf). The graphs display the mean for each group and * indicates statistically significant differences between MSS and MSI (p<0.05 using Mann-Whitney U test).

