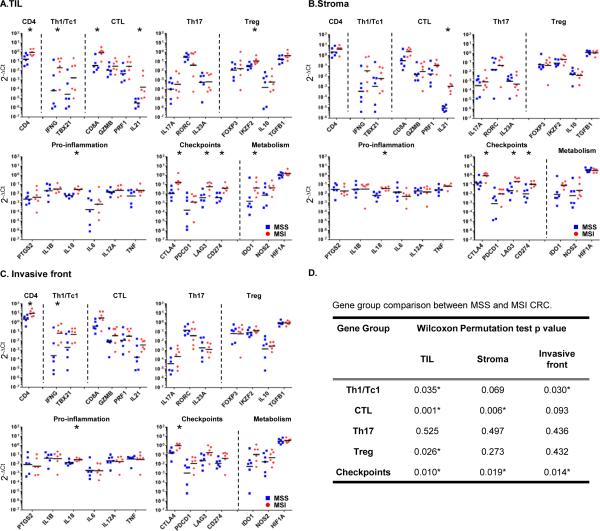
Figure 2. Th1 and CTL based immune signature and elevated checkpoint expression in MSI CRC.
RNA was extracted from tissue samples laser-microdissected representing TIL in tumor nests (A), stroma surrounding tumor (B) and invasive front (C) areas of MSS (blue squares) and MSI (red circles) CRC specimens. Immune-related gene expression profiles were assessed using Taqman-based qRT-PCR for selected genes. Sets of genes were defined by functional relevance (Th1/Tc1, CTL, Th17, Treg, pro-inflammation, immune checkpoints and metabolism). The Y axis represents an arbitrary unit of expression 2−ΔCt, ΔCt representing cycle threshold (Ct) of the gene of interest normalized by Ct of ubiquitous genes (GUSB, GAPDH). The graphs display the geometric means. Their differential representation between MSS and MSI specimens was analyzed using adjusted Wilcoxon Mann Whitney test as described in Methods section. *, Wilcoxon p-value < 0.05. D, gene group comparison in TIL, tumor stroma and invasive front areas between MSS and MSI specimens.Permutation Test Results based on the maximum Wilcoxon Mann Whitney test statistic within the gene groups Th1/Tc1, CTL, Th17 and immune checkpoints. * indicates statistically significant differences between MSS and MSI (p<0.05).

