
Fig 12.
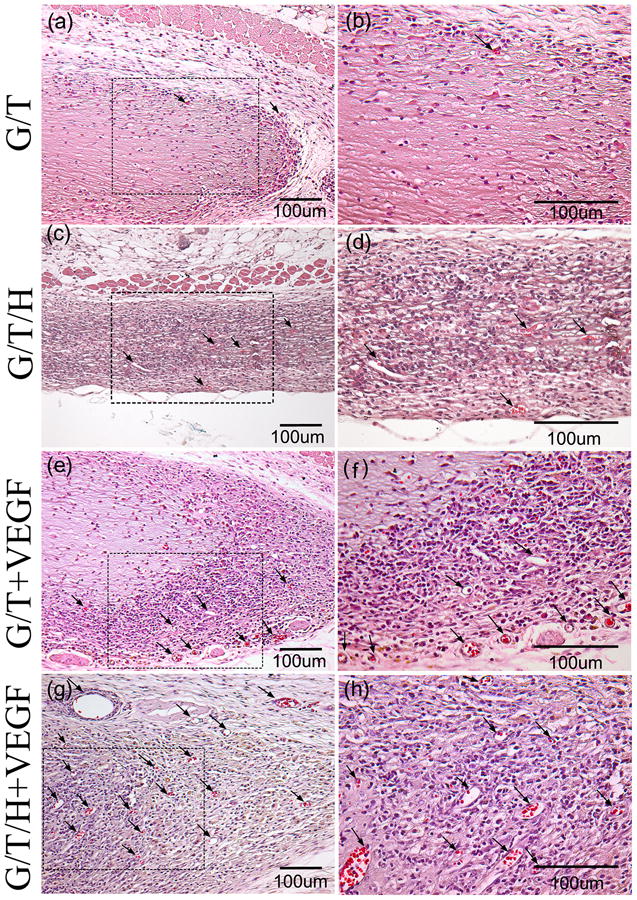
H&E staining images of the G/T/H constructs after subcutaneous implantation for 2 weeks. (a, b) H&E staining of the G/T hydrogel. (c, d) H&E staining of the G/T/H hydrogel. (e, f) H&E staining of the VEGF-loaded G/T hydrogel. (g, h) H&E staining of the VEGF-loaded G/T/H hydrogel. (b), (d), (f) and (h) are high magnification images of the dotted box in (a), (c), (e) and (g), respectively. Scale bars indicate 100 μm. Arrows indicate blood vessels.