
Figure 1.
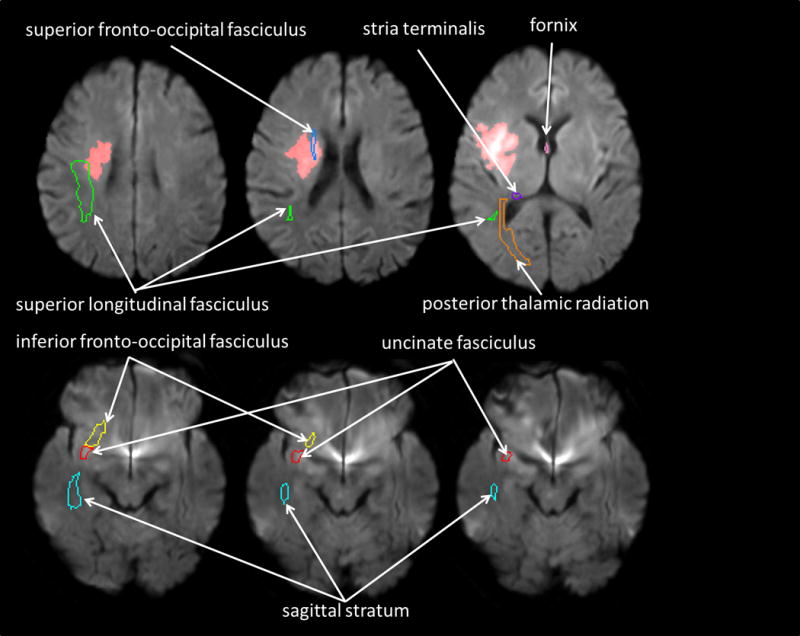
A pre-defined set of three-dimensional ROIs [right fornix (pink contour), right stria terminalis (purple contour), right inferior fronto-occipital fasciculus (yellow contour), right posterior thalamic radiation (orange contour), sagittal stratum (cyan contour), superior fronto-occipital fasciculus (blue contour), superior longitudinal fasciculus (green contour), and uncinate fasciculus (red contour)] on the atlas space was overlaid on the normalized stroke map to report % volume of each ROI affected by the infarction. In this figure, the normalized stroke map (red area) was overlaid on the normalized DWI.