
Figure 2.
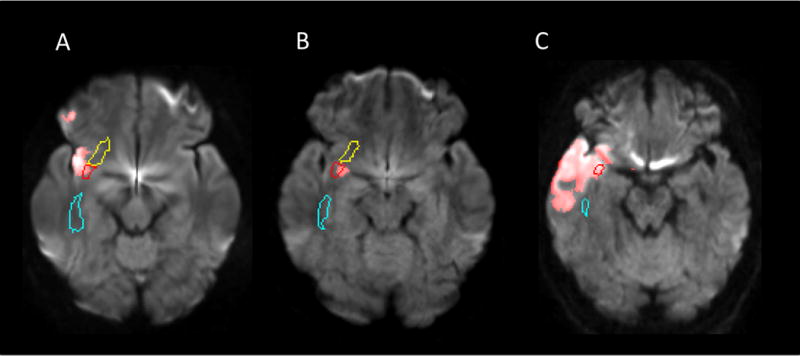
Representative three individuals (A, B and C) with acute infarction in the uncinate fasciculus (red contour). The normalized stroke maps (red area) were overlaid on the DWIs normalized to the JHU-MNI atlas space and pre-defined ROIs were overlaid on the normalized images. The right inferior fronto-occipital fasciculus (yellow contour) and the sagittal stratum (cyan contour) were also visualized in these slices.