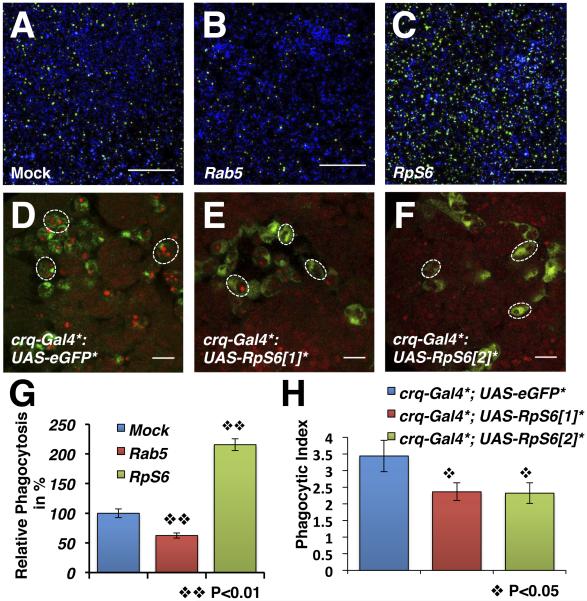
Figure 4. RpS6 acts as a negative regulator of AC clearance.
(A-C) Phagocytosis of ACs by mock- (A), Rab5 RNAi- (B) or RpS6 RNAi- (C) treated S2 cells. Live cells are blue, engulfed FITC-labeled ACs are green. Scale bars represent 200 μm. (D-F) Merged confocal images of yw; +; crq-Gal4, UAS-eGFP (wild-type reference)(D), and yw; UAST-RpS6; crq-Gal4, UAS-eGFP macrophages with two independent transgenic UAST-RpS6 lines [1] and [2] in E and F, respectively. ACs are stained with 7-AAD (red), GFP-expressing macrophages appear green. Scale bars represent 10 μm. (G) Graph summarizing the quantification of A-C with rab5-RNAi S2 cells as a control. Bars represent the relative phagocytosis when compared to mock-treated S2 cells ± SEM of three independent experiments with duplicated wells. (H) Graph showing the mean PIs ± SEM for each genotype in D-F. See also Fig. S3.

