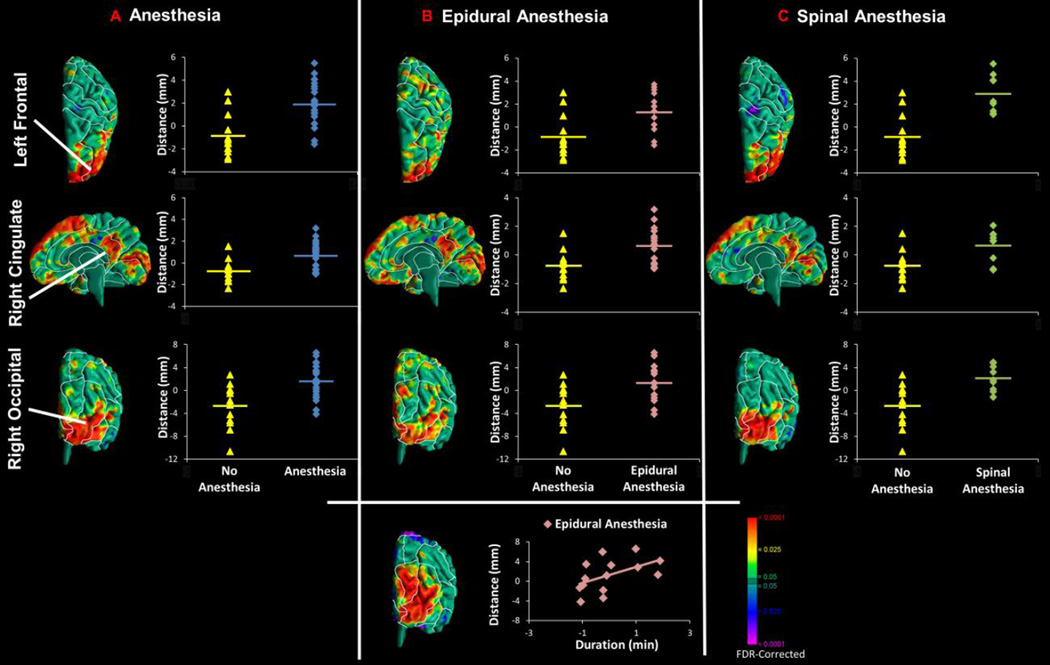
Figure 3. Scatterplots for Anesthesia, Type of Regional Block, and Duration of Exposure Findings.
Scatterplots are shown for exposure effects in morphological measures of the cerebral surface. Pvalues are FDR-adjusted for multiple comparisons. (A–C) Points on the surface of the template brain are shown where the data were sampled to generate the scatterplots. These were within regions where infants exposed or unexposed to anesthesia differed significantly in local volumes (or, more strictly, in mm distance from the surface of the template brain). (B) In the bottom panel is shown the scatterplot representing the positive correlation of exposure duration (an estimate of the dose of epidural anesthesia that exposed infants received) with local volumes in the occipital lobe bilaterally.

