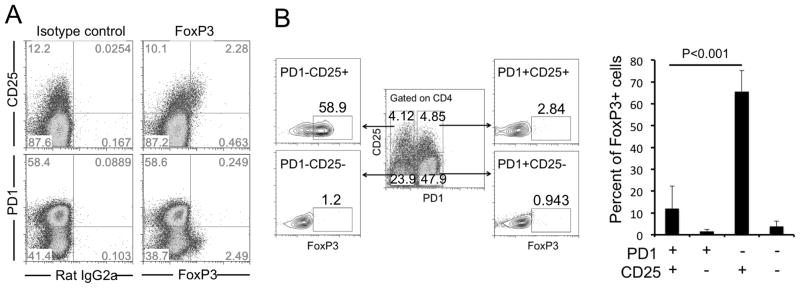
Figure 2. CD25+PD1+CXCR5+CD4+ T cells are not Treg cells.

(A) Tonsil CD4+ T cells were purified, stained and analyzed by flow cytometry. (B) Tonsil cells were gated on CD4 expression to determine the percentage of FoxP3+ cells in PD1−CD25+ (58.9%), PD1−CD25− (1.2%), PD1+CD25+ (2.8%) or PD1+CD25− (0.9%). Data are summarized in a bar graph showing mean (+SEM) percentages of FoxP3+cells (n=7 donors) and are representative of 3 independent experiments. P < 0.05 was considered to be significant; Student’s t test.
