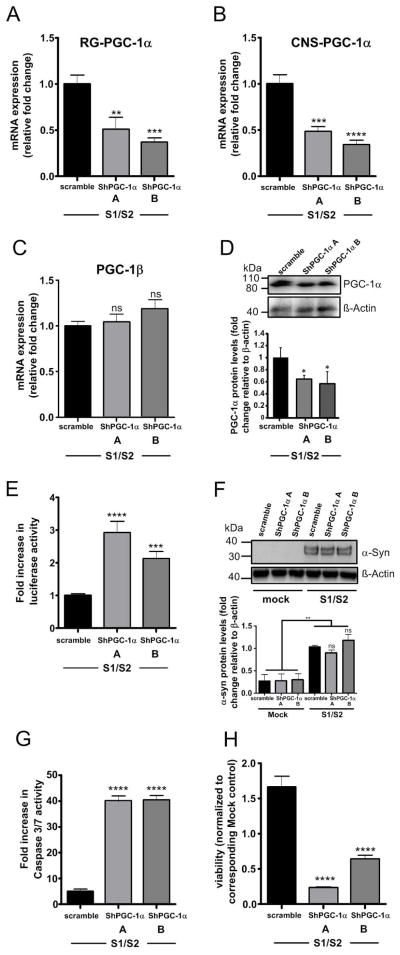
Figure 3. RG-and CNS-PGC-1α knockdown increases α-syn oligomerization and resulting toxicity.
(A) RT-qPCR analysis of RG-PGC-1α from H4 cells co-transfected with S1/S2 and the two independent ShRNAs (ShPGC-1α-A and ShPGC-1α-B.). mRNA levels were standardized using POLR2A and TBP. A total of four independent experiments were performed. *p<0.05, **p<0.01, ***p<0.005. (B) RT-qPCR analysis of CNS-PGC-1α from H4 cells co-transfected with S1/S2 and the two independent ShRNAs (ShPGC-1α-A and ShPGC-1α-B). mRNA levels were standardized using POLR2A and TBP. A total for four independent experiments were performed. *p<0.05, **p<0.01, ***p<0.005. (C) RT-qPCR analysis of PGC-1β from H4 cells co-transfected with S1/S2 and the two independent ShRNAs (ShPGC-1α-A and ShPGC-1α-B). mRNA levels were standardized using POLR2A and TBP. A total of three independent experiments were performed showing that PGC-1β expression is not affected by PGC-1α ShRNAs. (D) Representative Western blotting showing PGC-1α and β-actin levels. PGC-1α levels are reduced in H4 cells co-transfected with S1/S2 and the two independent ShRNAs (ShPGC-1α-A and ShPGC-1α-B). Bar Graph represents the densitometric quantification of Western blots, n=3, *p<0.05. (E) Luciferase assay from H4 cells 24h post-infection with indicated lenti-shRNAs and co-transfection with S1/S2. Six independent experiments were performed. ***p<0.005. ****p<0.001. (F) Representative Western blots showing α-syn and β-actin levels from H4 cells co-transfected with S1/S2 and the two independent ShRNAs (ShPGC-1α-A and ShPGC-1α-B). Bar Graph represents the densitometric quantification of Western blots, n=4, **p<0.01. Note that equal amounts of S1/S2 are produced in both Sh-scramble and ShPGC-1α conditions. (G) H4 cells 24h post-infection with indicated lenti-shRNAs and co-transfection with S1/S2 were assayed for Caspase 3–7 activity. A total for three experiments were performed. ***p<0.005, ****p<0.001. (H) 24h post-infection with indicated lenti-shRNAs and co-transfection with S1/S2 cytotoxicity was assessed in H4 cells using the cell titer glow assay which measures ATP levels in cells. Values are normalized to respective mock controls. ShPGC-1a A and ShPGC1a B are presented in relation to the Sh-scramble control. A total for three independent experiments were performed,***p<0.005, ****p<0.001.

