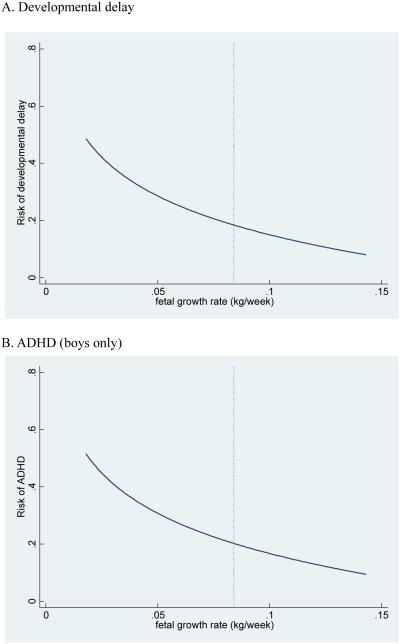
Figure 1.
Estimated Effects of Fetal Growth Rate on Selected Developmental Disabilities
Figure note: The vertical dotted line represents the sample mean of fetal growth rate. The risk curve is created based on the estimated elasticities in table 4. We depict an ADHD figure for boys only because the negative effect of fetal growth rate on ADHD is found only among boys (see table 4 and 5).

