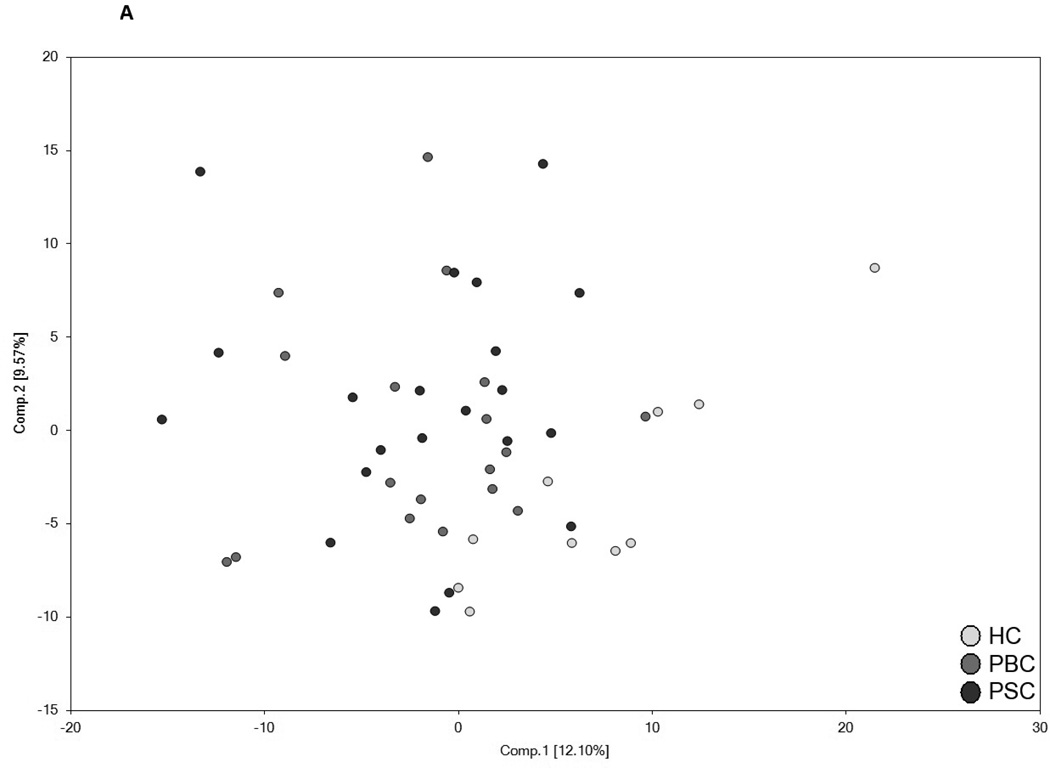
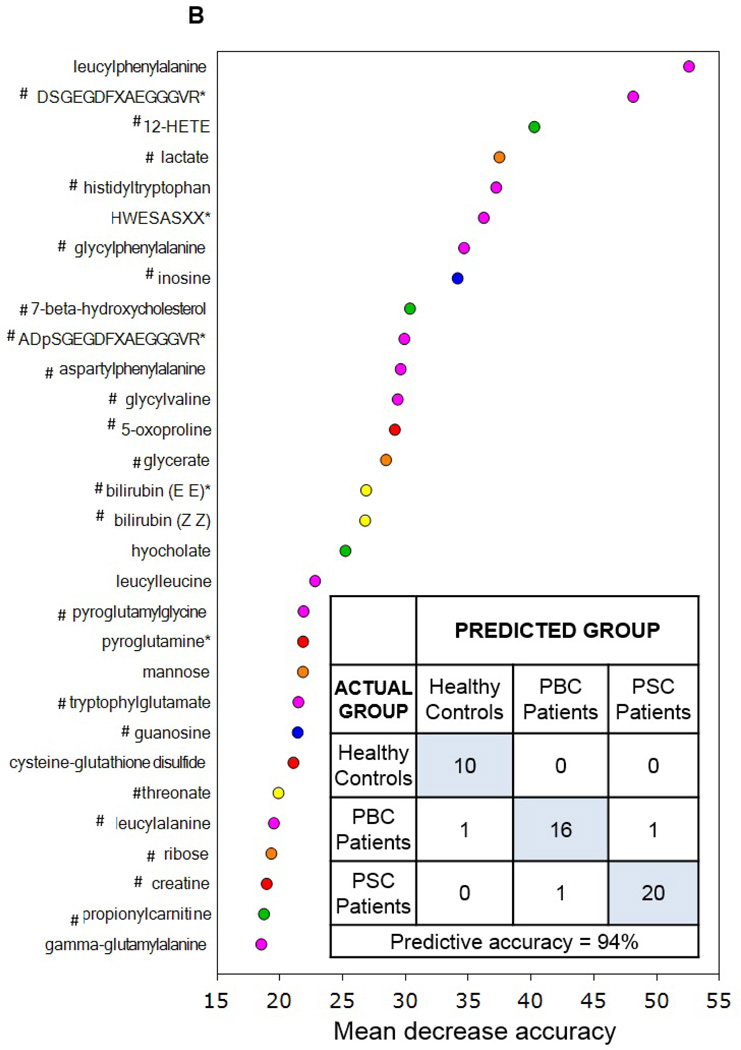
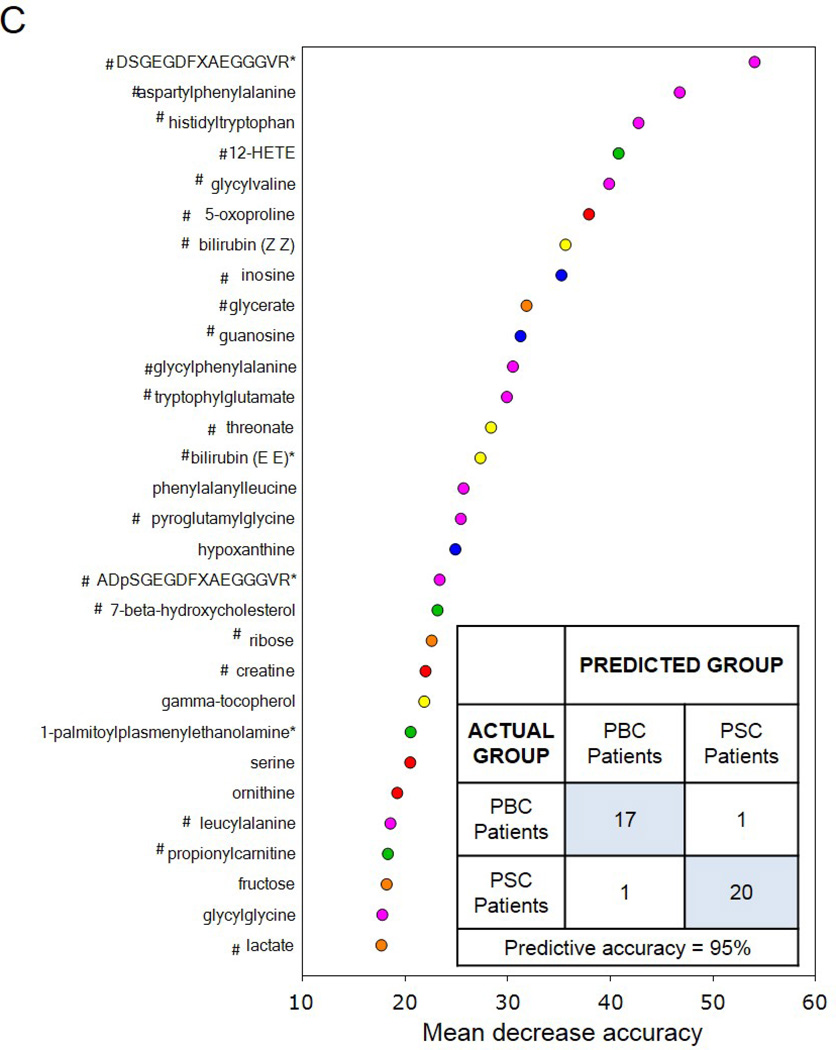
Figure 2.
Utilization of global metabolic profiles for classification of control subjects and patients by disease type by principal component analysis (PCA) and random forest analysis (RF). Results from the PCA (Panel A) demonstrated that healthy control subjects (HC; clear circles) were quite distinguishable from those with cholestatic disease, but that a substantial amount of overlap was present when differentiating patients with PBC (light grey circles) and PSC (dark grey circles). Classification of all three study groups (Panel B) or the two liver disease groups (Panel C) by RF gave overall predictive accuracies of 94% and 95% (inset confusion matrices), respectively, and 22 common metabolites (designated by#) were identified within the biochemical importance plots generated from the RF analyses. Importance plots display both rank of metabolites according to the contribution of each to the classification scheme (mean decrease accuracy) and biochemical pathway identifications (red=amino acid, orange=carbohydrate/energy, yellow=cofactors and vitamins, green=lipid, blue=nucleotide, and pink=peptide).


